Futures have pushed higher to 4582. With that we look for a lower volatility day, in line with yesterdays session (0.6% open/close range). Resistance shows at 4600 & 4616 (SPY 460), support is at 4550 then 4520.
Key to our updated data is the SPY Call Wall which shifted higher to 460. The Vol Trigger also jumps higher to 4520. We we these shifts as supportive of current market prices as it suggests options positions are rolling up along with higher market prices. Barring a roll higher in the Call Wall, a close above the 460SPY/4600SPX level signals an overbought market.
The volatility crush is certainly front and center, with the VIX breaking back below 20 for the first time since mid-January. Along with that we are seeing speculative fervor akin to that of last year, with huge 5 day rallies in names like GME (+94%), AMC(+83%), & TSLA(+17%).

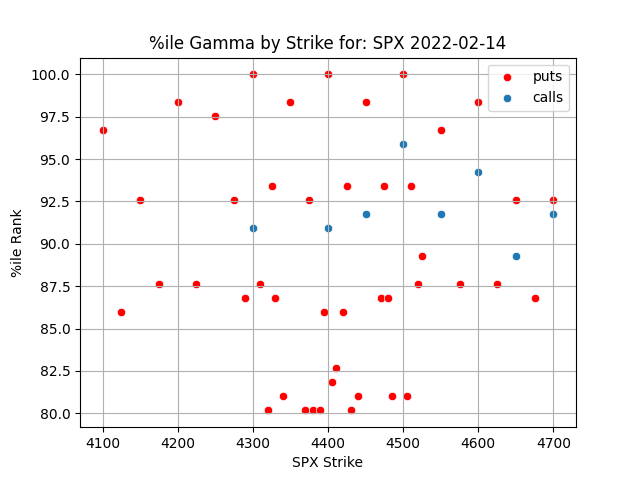
Aside from the animal spirits, this push higher in the S&P does draw out more material positive gamma. In the short term this serves to suppress volatility and support markets. To this point its anecdotally been a been quite a while since we have seen a large call gamma strike but they are now starting to register. Shown below is a percentile ranking of current gamma by strike, with data going back 1 year. You can see the 4600 call is now up above 97.5% suggesting a shift in the SPX back to “call control” vs the last several months of “put control” (ex: chart from 2/14).
The point here is this 4600 level marks the area in which call trading may dictate the movement of the S&P more so than the decay and closure of put options. Therefore for this rally to continue we want to see the Call Wall’s roll up to higher strikes which indicates calls are filling in at strikes overhead.
To the downside, due to the large gamma strikes now below, we think that it would take a few days of selling to hit 4500. Below 4500 that air pocket remains, but the risk of breaking into that zone over the next 1-2 sessions seems materially reduced due to our 1 day volatility forecasts of 27pt open/close range(s).
| SpotGamma Proprietary Levels | Latest Data | Previous | SPY | NDX | QQQ |
|---|---|---|---|---|---|
| Ref Price: | 4543 | 4543 | 455 | 14758 | 364 |
| SpotGamma Imp. 1 Day Move: Est 1 StdDev Open to Close Range |
0.6%, | (±pts): 27.0 | VIX 1 Day Impl. Move:1.23% | ||
| SpotGamma Imp. 5 Day Move: | 2.26% | 4543 (Monday Ref Px) | Range: 4440.0 | 4646.0 | ||
| SpotGamma Gamma Index™: | 0.76 | 0.53 | 0.02 | 0.03 | -0.02 |
| Volatility Trigger™: | 4520 | 4400 | 453 | 14050 | 358 |
| SpotGamma Absolute Gamma Strike: | 4600 | 4500 | 450 | 14225 | 360 |
| Gamma Notional(MM): | 65.0 | 94.45 | 78.0 | 4.0 | -143.0 |
| Additional Key Levels | Latest Data | Previous | SPY | NDX | QQQ |
|---|---|---|---|---|---|
| Zero Gamma Level: | 4506 | 4506 | 0 | 0 | 0 |
| Put Wall Support: | 4510 | 4510 | 440 | 13000 | 325 |
| Call Wall Strike: | 4600 | 4600 | 460 | 14225 | 368 |
| CP Gam Tilt: | 1.29 | 1.07 | 1.03 | 1.53 | 0.89 |
| Delta Neutral Px: | 4452 | ||||
| Net Delta(MM): | $1,358,233 | $1,332,148 | $158,635 | $41,633 | $96,048 |
| 25D Risk Reversal | -0.07 | -0.08 | -0.06 | -0.03 | -0.07 |
| Key Support & Resistance Strikes: |
|---|
| SPX: [4600, 4550, 4510, 4500] |
| SPY: [460, 455, 450, 440] |
| QQQ: [370, 365, 360, 350] |
| NDX:[16000, 15500, 15000, 14225] |
| SPX Combo (strike, %ile): [4566.0, 4616.0, 4666.0, 4516.0, 4543.0] |
| SPY Combo: [458.19, 463.2, 468.22, 453.17, 455.91] |
| NDX Combo: [14876.0, 14758.0, 14965.0, 14360.0, 15171.0] |


