Macro Theme:
- A sustained rally is unlikely to occur until May 4th which holds the FOMC & Russian default. Due to these events, volatility (i.e. large puts) is unlikely to be meaningfully sold. This prevents an extended rise in equities.
- We see substantial, longer term support at 4050.
Daily Note:
Futures are near 4280, up from overnight lows of 4268. We anticipate volatility similar to that of yesterday, with an SG Implied move of 1.16%. Resistance is at 4300 and 4315 (SPY 430 equivalent). Light support shows near 4260(SPY 425) with more material support at 4210.
Yesterdays action was short covering, which makes the rally unstable. Puts >=SPY 430 were net closed, as shown below. Recall that as puts are sold, dealers may be able to buy back futures. Further, we saw a large amount of calls (23k) & puts (34k) added to the 4300 line, which adds to resistance near that strike.

This higher 4300 volume after a large rally may add a “cap” to the equities rally. We saw similar things to large strikes in previous short cover rallies. For example, a short cover rally several weeks ago into 4500 initiated this large straddle type volume. Markets declined from there, and on a rally into 4400 that straddle volume appeared, too. Through our lens this two side flow (calls and put) at lower strikes is large traders accepting the lower S&P prices.
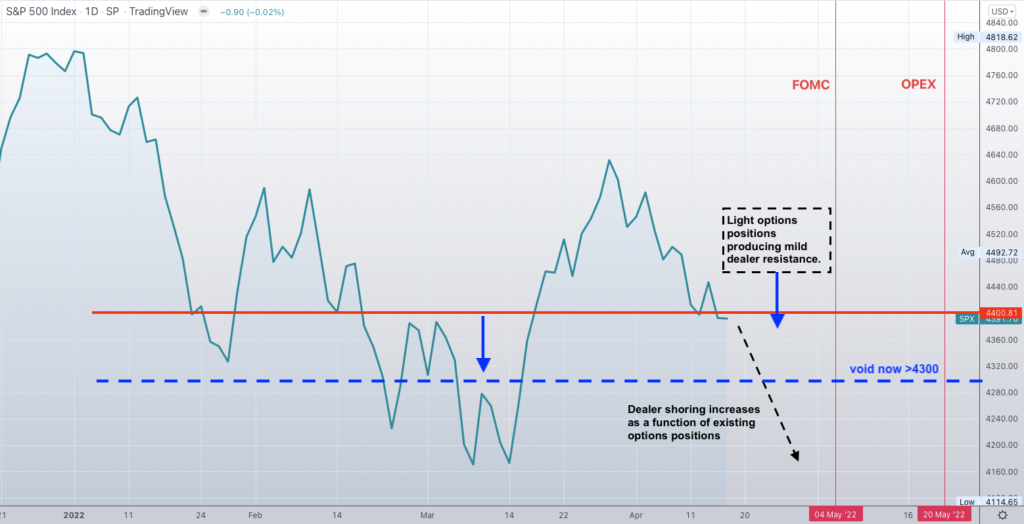
Seen another way, you may remember the “map” below, which was posted last week. The key level at that time was 4400, and we commented that there was a void above, and reflexive dealer selling below (dealers sell futures as the market declines, leading to incremental selling). Now we see that 4400 line rolling down to 4300, which creates a void from 4300-4400.
Again, we highlight 5/4 as a major date as the FOMC and Russian default deadline occur on that day. We anticipate these events to catalyze implied volatility leading to a substantial directional move. This is still 6 trading sessions away, and so markets are going to be subject to some wild swings but we see these swings as a function of simple put-heavy positioning. Dealers are going to short as the market drops and buy as the market rallies.
Additionally a lot of the flow is being dictated by very short dated options trades which leads to frenetic hedging. Its on 5/4 that the larger, more material flow is initiated (i.e. day traders are shoved aside by macro funds).
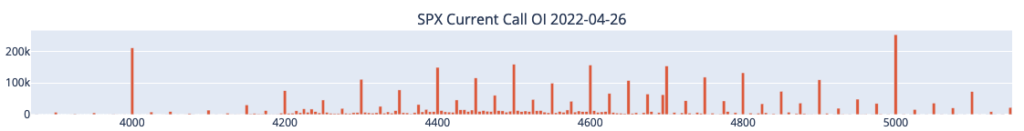
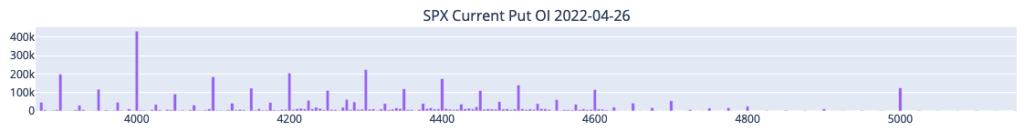
Finally, we want to note that we see a lower bound here which is the 4000 level. Shown below is the current open interest for SPX, and you can see at left there is a substantial amount of both puts and calls at the 4000 strike. We see this as material, long term support which should hold unless we see some type of credit event (i.e. defaults).
| SpotGamma Proprietary Levels | Latest Data | Previous | SPY | NDX | QQQ |
|---|---|---|---|---|---|
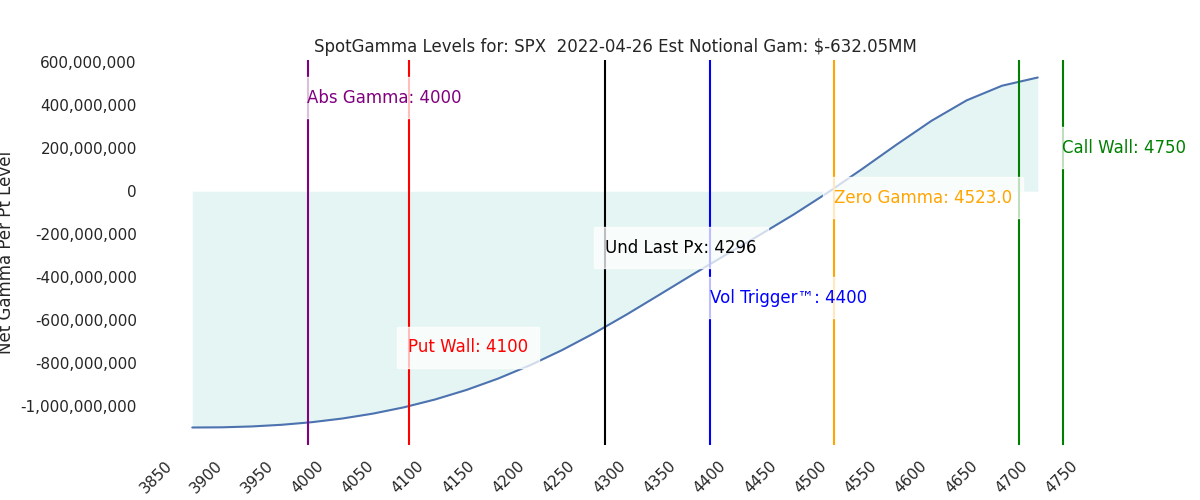
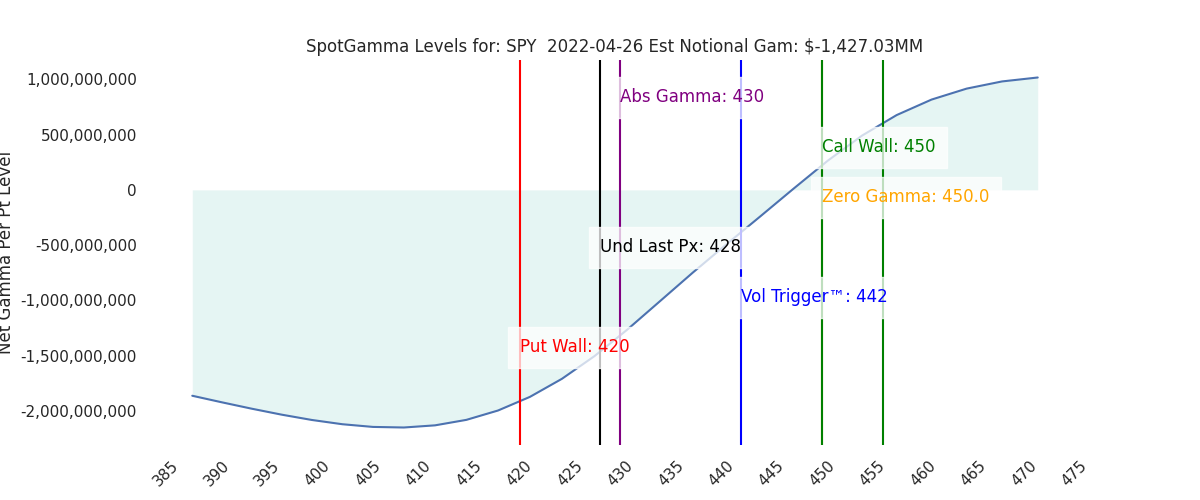
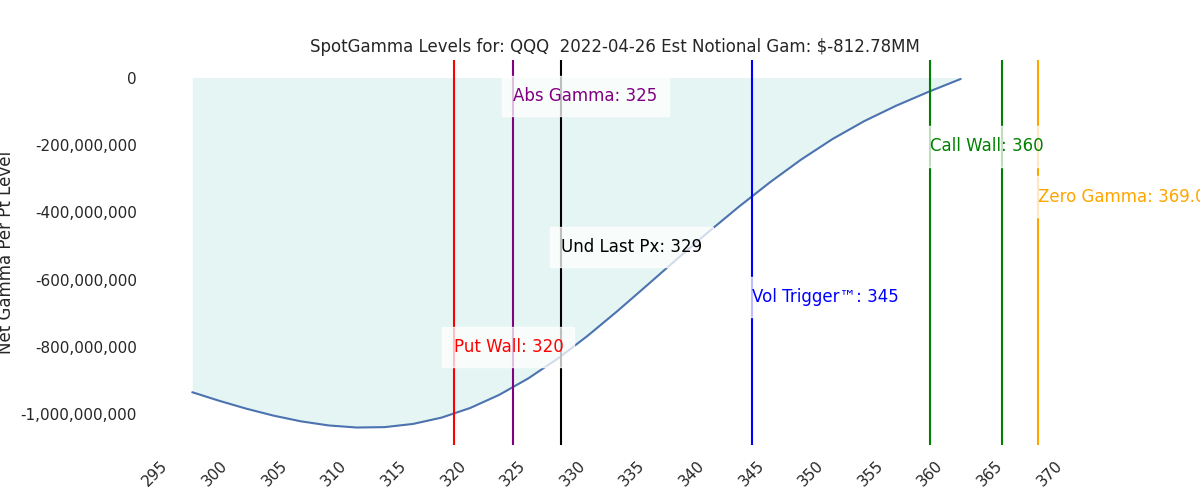
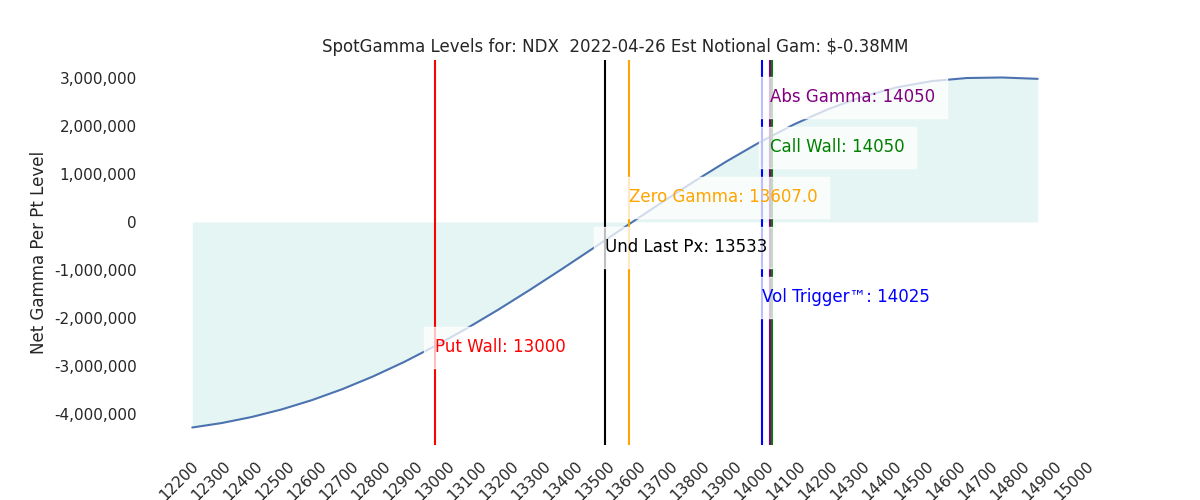
| Ref Price: | 4296 | 4297 | 428 | 13533 | 329 |
| SpotGamma Imp. 1 Day Move: Est 1 StdDev Open to Close Range | 1.16%, | (±pts): 50.0 | VIX 1 Day Impl. Move:1.7% | ||
| SpotGamma Imp. 5 Day Move: | 2.67% | 4271 (Monday Ref Px) | Range: 4158.0 | 4386.0 | ||
| SpotGamma Gamma Index™: | -1.20 | -1.3 | -0.32 | -0.00 | -0.14 |
| Volatility Trigger™: | 4400 | 4450 | 442 | 14025 | 345 |
| SpotGamma Absolute Gamma Strike: | 4000 | 4000 | 430 | 14050 | 325 |
| Gamma Notional(MM): | -632.0 | -585.63 | -1427.0 | -0.0 | -813.0 |
| Additional Key Levels | Latest Data | Previous | SPY | NDX | QQQ |
|---|---|---|---|---|---|
| Zero Gamma Level: | 4523 | 4490 | 0 | 0 | 0 |
| Put Wall Support: | 4100 | 4100 | 420 | 13000 | 320 |
| Call Wall Strike: | 4750 | 4750 | 450 | 14050 | 360 |
| CP Gam Tilt: | 0.68 | 0.6 | 0.5 | 0.96 | 0.5 |
| Delta Neutral Px: | 4438 | ||||
| Net Delta(MM): | $1,621,462 | $1,317,564 | $166,790 | $42,832 | $110,667 |
| 25D Risk Reversal | -0.1 | 0.0 | -0.09 | -0.1 | -0.1 |
| Call Volume | 582,692 | 297,193 | 1,903,715 | 7,187 | 985,676 |
| Put Volume | 1,186,435 | 608,657 | 3,238,961 | 7,469 | 1,267,234 |
| Call Open Interest | 4,946,543 | 4,002,976 | 5,572,937 | 45,448 | 3,457,884 |
| Put Open Interest | 9,434,983 | 8,038,392 | 10,136,983 | 48,197 | 6,346,674 |
| Key Support & Resistance Strikes: |
|---|
| SPX: [4400, 4300, 4200, 4000] |
| SPY: [440, 435, 430, 420] |
| QQQ: [340, 330, 325, 320] |
| NDX:[15000, 14050, 14000, 13000] |
| SPX Combo (strike, %ile): [4202.0, 4300.0, 4249.0, 4210.0, 4270.0] |
| SPY Combo: [419.08, 428.94, 423.8, 419.94, 425.94] |
| NDX Combo: [13141.0, 13344.0, 13750.0, 13547.0] |