Futures have done nothing overnight, maintaining 4280. 430SPY/4300SPX shows as a major sticking/resistance point due to the large amount of gamma at that strike. With that we forecast a max move today of just 67bps which is about as low as we’ve seen in some time. Major support lies at 4260.
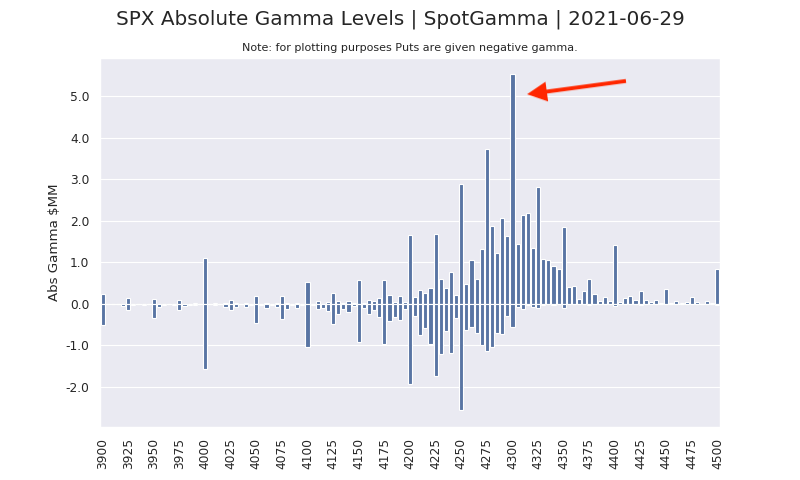
Based on this large 4300 gamma we look for the market taking some time to “digest” this level, and consider it a major resistance area. As 4300 is the Call Wall, its marked as the top of our trading range until/unless the model shows us a higher Call Wall strike. As you can see in the chart above, there are no other strikes which seem poised to overtake 4300 in gamma size.
One thing that caught our eye last night was the fact that VIX closed in positive territory. This was a bit odd given the market was higher, and realized volatility continues to collapse. Relatedly, we note today that the Risk Reversal metric is at -0.7. As the RiskReversal metric weighs the price of call options vs puts, this suggests that traders are paying a bit more for puts. Historically -0.5 is the “lowest” reading, and the one that generally appears with placid markets.
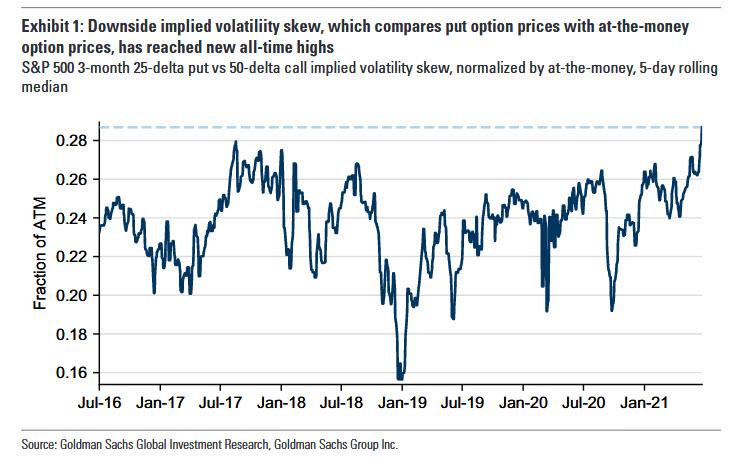
Via ZeroHedge we came across this research from Goldman which highlighted elevated skew. This skew essentially measures the price of tail risk, with a higher reading suggesting tail risk hedges are in demand. As you can see in their chart below, this reading is a recent highs. The implication here is that traders are paying up for hedges despite a market that shifts relentlessly higher.
The summary from Goldman:
As Fishman elaborates, SPX implied volatility skew is at or near records for shorter-dated tenors, with put-vs-ATM skew especially strong. And while high skew does not have to mean that put prices are high, “the combination of high volatility risk premium and high skew does point to expensive puts.”
Putting it all together, Goldman summarizes that the current level of skew reflects views that:
1) should the market sell off, it would do so in a volatile way;
2) there is unfavorable asymmetry in potential returns; and
3) stocks would become increasingly correlated with each other in a sell-off.
Model Overview:
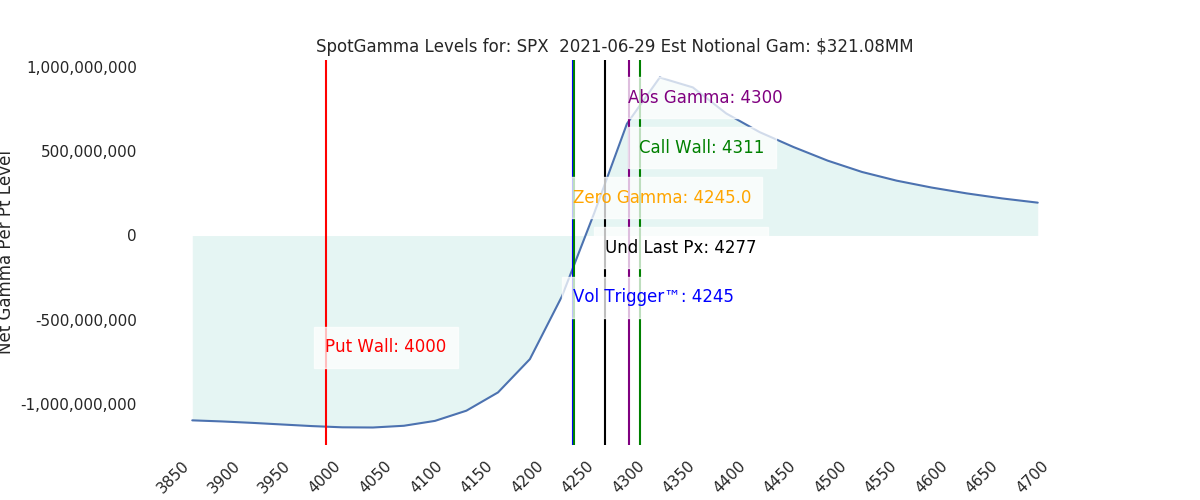
4300 top, 4250 major support into July OPEX.
| SpotGamma Proprietary Levels | Latest Data | Previous | SPY | NDX | QQQ |
|---|---|---|---|---|---|
| Ref Price: | 4277 | 4278 | 427 | 14484 | 353 |
| SpotGamma Imp. 1 Day Move: | 0.67%, | 29.0 pts | Range: 4248.0 | 4306.0 | ||
| SpotGamma Imp. 5 Day Move: | 4269 | 1.97% | Range: 4185.0 | 4353.0 | ||
| SpotGamma Gamma Index™: | 1.57 | 1.25 | 0.21 | 0.06 | 0.04 |
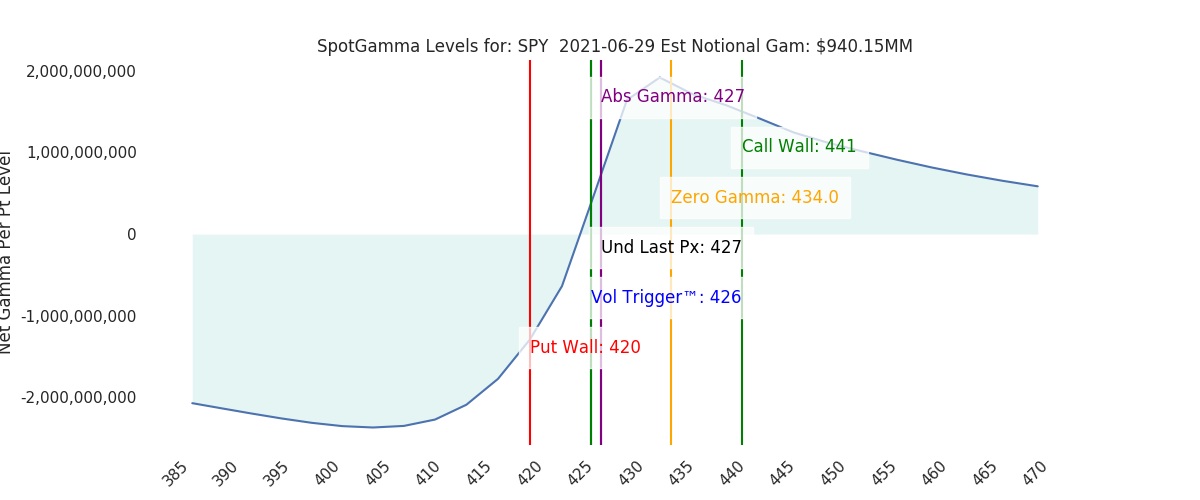
| Volatility Trigger™: | 4245 | 4245 | 426 | 13860 | 349 |
| SpotGamma Absolute Gamma Strike: | 4300 | 4250 | 427 | 14100 | 350 |
| Gamma Notional(MM): | $321 | $444 | $940 | $8 | $156 |
| Additional Key Levels | Latest Data | Previous | SPY | NDX | QQQ |
|---|---|---|---|---|---|
| Zero Gamma Level: | 4245 | 4246 | 0 | 0 | 0 |
| Put Wall Support: | 4000 | 4000 | 420 | 12000 | 330 |
| Call Wall Strike: | 4300 | 4300 | 430 | 14100 | 355 |
| CP Gam Tilt: | 1.57 | 1.29 | 1.29 | 2.28 | 1.12 |
| Delta Neutral Px: | 4129 | ||||
| Net Delta(MM): | $1,113,160 | $1,195,628 | $155,714 | $28,438 | $73,197 |
| 25D Risk Reversal | -0.07 | -0.06 | -0.05 | -0.05 | -0.05 |
| Top Absolute Gamma Strikes: |
|---|
| SPX: [4300, 4275, 4250, 4200] |
| SPY: [430, 428, 427, 425] |
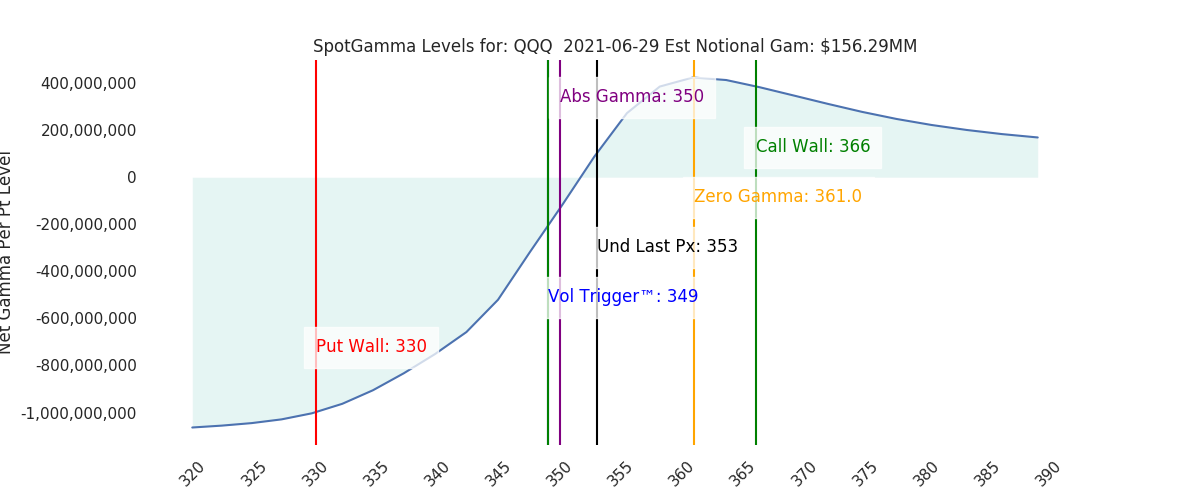
| QQQ: [355, 353, 352, 350] |
| NDX:[15000, 14500, 14100, 14000] |
| SPX Combo: [4286.0, 4311.0, 4260.0, 4303.0, 4337.0] |
| NDX Combo: [14538.0, 14741.0, 14060.0, 14408.0, 14610.0] |

0 comentarios