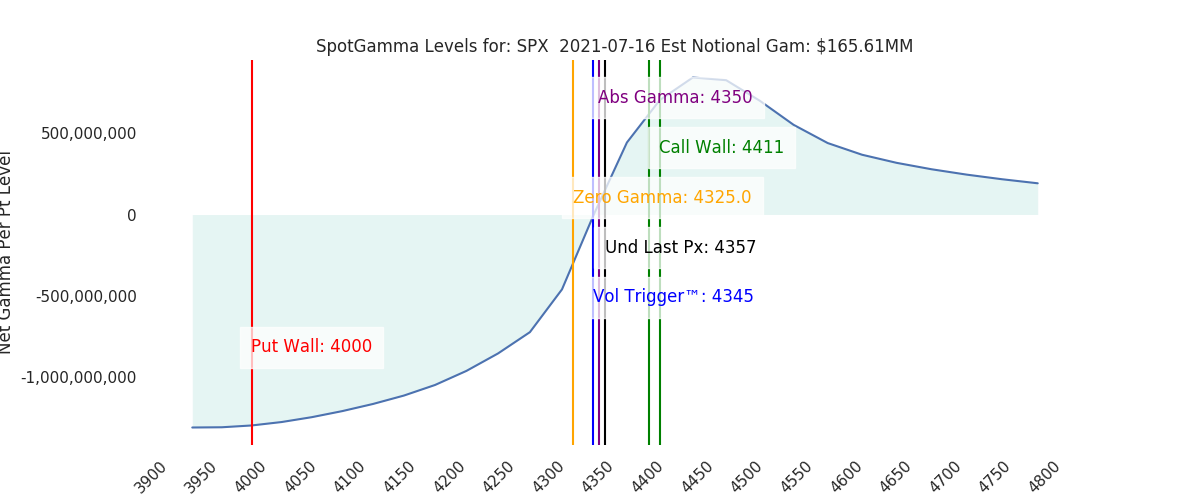
Futures touched a low of 4340 overnight before pushing higher – current 4360. This indicates an opening near 4375 which is our largest gamma strike. As a reminder the bulk of SPX options expire on the open, with equities and some smaller SPX expiring at 4pm EST. We see 30% of gamma rolling off for SPX, SPY and QQQ today making this a fairly large expiration. Furthermore 48% of single stocks have their most concentrated gamma position expiring at 4:15.
We do not anticipate a lot of volatility for today, but anticipate a pickup in movement next week. We’ve certainly been pinned to the 4350-4400 range for the last week. With that for next week we are looking for markets to break either 4400 or 4300, with 4500 setting up as a major upside target for the August expiration cycle. To the downside it looks like the 4350 area will be the gamma flip point with 4300 being the major “risk off” level due to negative gamma.
Around July 1st markets put in a low in realized volatility, and we think that will be the low for the year. Plotted below are the implied volatility levels for all 25 delta options, with each color representing a different number of days to expiration. You can see that July 1 was also a low for implied volatility in the S&P. With that, implied volatility has increased suggesting markets are primed for a bit more movement.
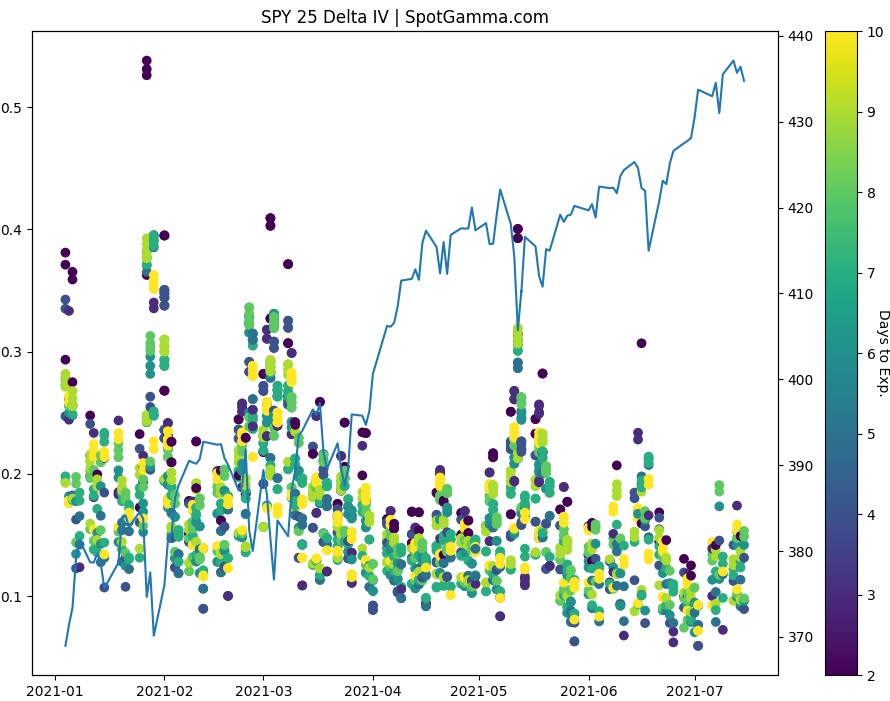
Higher implied volatility lines up ahead of the post-OPEX volatility window opening which suggests that if markets wanted to sell the options mechanics are lining up to “expand” that selling. Seeing both sides, this could also simply be another opportunity for traders to sell volatility at slightly higher levels, and slide this market up to new highs.
You’re probably thinking “great, he said markets could go up or down” and the answer is “yes”. However we’ve been calling for essentially no movement in markets over the past week and that has been the case. Now we see an upside window to break through 4400, but also the opportunity to spark a rather nasty selloff.
Its that selloff that has us concerned. Markets reflexively sell volatility every time its offered and that trade has worked out quite well for the past year (ie buy the little dips!). There will be a point in which the forces that initially sell will overrun those early volatility sellers and we think that leads to a very nasty unwind (as we mentioned before, think Sep ’20).
There is a large amount of open interest down at the 4000 strike, and we can’t help to flag that as a major downside support level that could be visited rather quickly. Keep in mind this is not a fundamental/macro call, just a view on the mechanics of positioning.
As always, rather than guessing we simply watch the Volatility Trigger level. Bulls hold the reigns above that, but if that line is broken then we think you must respect the change for a nasty left tail move.
Model Overview:
July OPEX today, new ranges setup next week.
| SpotGamma Proprietary Levels | Latest Data | Previous | SPY | NDX | QQQ |
|---|---|---|---|---|---|
| Ref Price: | 4357 | 4351 | 434 | 14772 | 360 |
| SpotGamma Imp. 1 Day Move: | 0.83%, | 36.0 pts | Range: 4321.0 | 4393.0 | ||
| SpotGamma Imp. 5 Day Move: | 4351 | 1.82% | Range: 4272.0 | 4430.0 | ||
| SpotGamma Gamma Index™: | 0.90 | 1.02 | 0.13 | -0.11 | -0.02 |
| Volatility Trigger™: | 4345 | 4340 | 432 | 15040 | 357 |
| SpotGamma Absolute Gamma Strike: | 4350 | 4350 | 435 | 14450 | 360 |
| Gamma Notional(MM): | $166 | $172 | $450 | $0 | $-224 |
| Additional Key Levels | Latest Data | Previous | SPY | NDX | QQQ | ||
|---|---|---|---|---|---|---|---|
| Zero Gamma Level: | 4325 | 4356 | 0 | 0 | 0 | ||
| Put Wall Support: | 4000 | 4000 | 430 | 14690 | 355 | ||
| Call Wall Strike: | 4400 | 4400 | 437 | 15500 | 361 | ||
| CP Gam Tilt: | 1.22 | 1.3 | 1.12 | 0.99 | 0.87 | ||
| Delta Neutral Px: | 4206 | ||||||
| Net Delta(MM): | $1,412,468 |
| $1,413,714 | $172,121 | $38,071 | $79,583 | |
| $1,413,714 | |||||||
| 25D Risk Reversal | -0.07 | -0.07 | -0.07 | -0.06 | -0.06 |
| Top Absolute Gamma Strikes: |
|---|
| SPX: [4400, 4375, 4350, 4300] |
| SPY: [437, 436, 435, 433] |
| QQQ: [362, 361, 360, 355] |
| NDX:[14800, 14700, 14690, 14450] |
| SPX Combo: [4399.0, 4373.0, 4351.0, 4382.0, 4452.0] |
| NDX Combo: [14600.0, 14837.0, 14852.0, 14393.0, 15208.0] |

0 comentarios