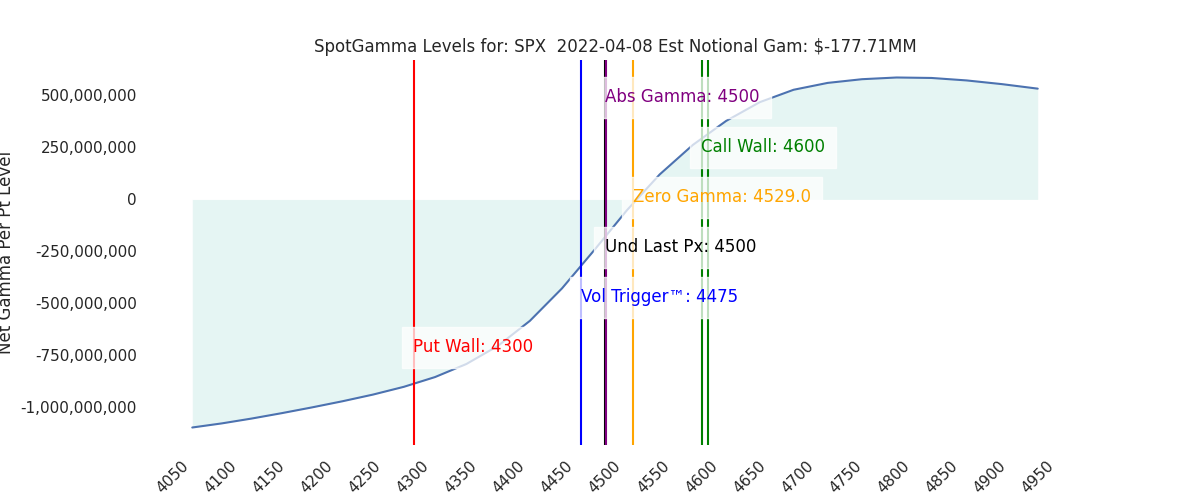
Futures are up a few points to 4510. Our gamma index is exactly 0, which forecasts a 1% intraday move (open/close) today. Support lies at 4500, then 4475. Resistance lies at 4520 (SPY 450) and then 4550.
While the SPX is in a fairly neutral stance, its of note that our vanna charts for SPY & QQQ suggest that implied volatility[IV] has heightened impact. You can see this dichotomy below, where in the SPX on the left has a slight right tilt, but the QQQ is much more skewed.
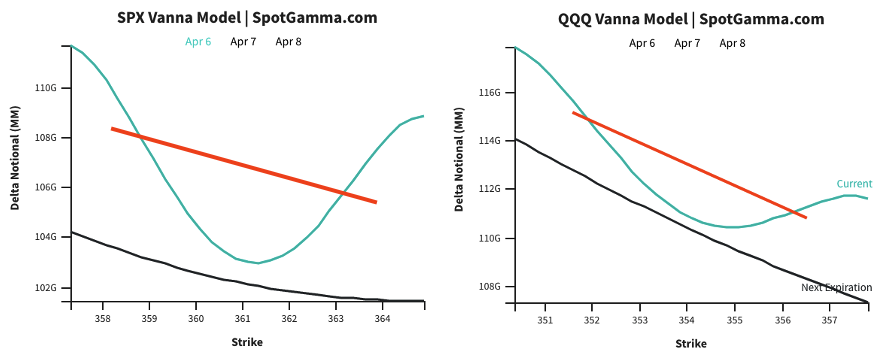
The more collapsed the skew is (like QQQ) then the more impactful changes in IV are on the asset. Therefore, vanna has more “meaning” in this environment, and because the tilt is to the right it indicates that the change in IV brings flows that are negatively correlated to the market. In other words, IV (aka VIX) up & dealers are shorting. IV down, and dealers are buying.
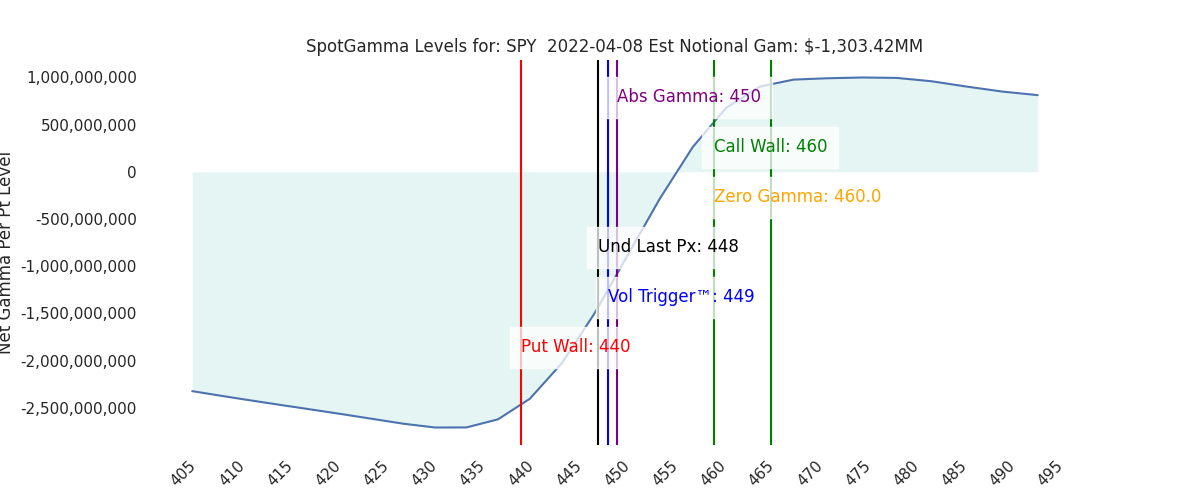
This setup generally leads to large directional swings, and quite frankly isn’t offering much in terms of direction. There is a fair amount of SPY gamma <=450 expiring today (~20% of total gamma) which can expand volatility for today. If we hold the 4500 level into mid day, then the fuel builds in the bulls favor due to put decay and vanna flows and we could see a fairly strong move higher, with 4550 a reasonable target.
Conversely, a break of 4500, particularly into the close indicates a higher level of risk to markets due to the onset of negative gamma. As mentioned last night, one has to respect that markets have twice now bounced from 4450 despite the elevated IV and elevated negative gamma. The setup was in place for an extended drawdown, but the S&P has held on.
| SpotGamma Proprietary Levels | Latest Data | Previous | SPY | NDX | QQQ |
|---|---|---|---|---|---|
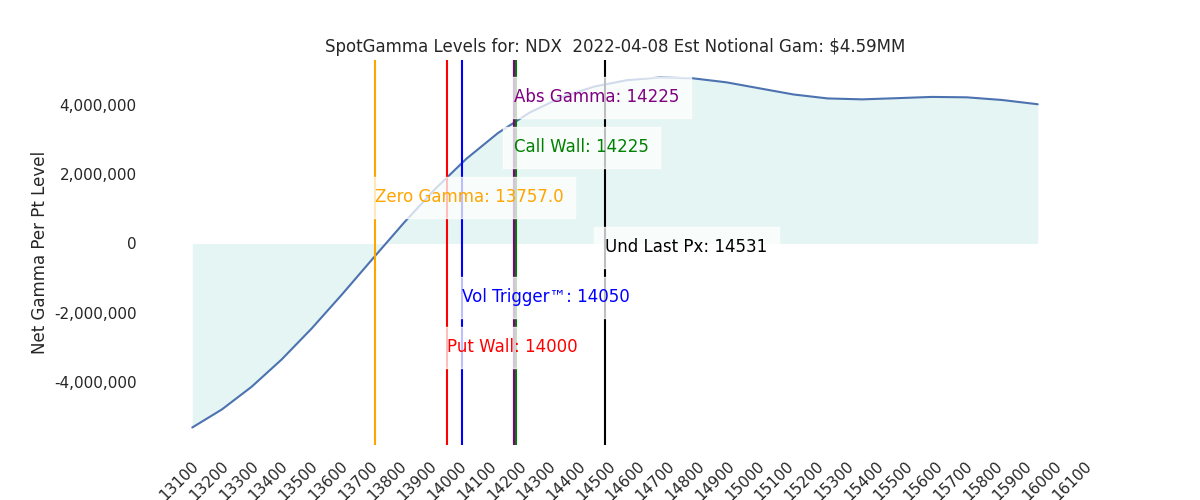
| Ref Price: | 4500 | 4500 | 448 | 14531 | 354 |
| SpotGamma Imp. 1 Day Move: Est 1 StdDev Open to Close Range | 1.0%, | (±pts): 45.0 | VIX 1 Day Impl. Move:1.36% | ||
| SpotGamma Imp. 5 Day Move: | 1.98% | 4545 (Monday Ref Px) | Range: 4456.0 | 4636.0 | ||
| SpotGamma Gamma Index™: | 0.00 | -0.26 | -0.28 | 0.03 | -0.15 |
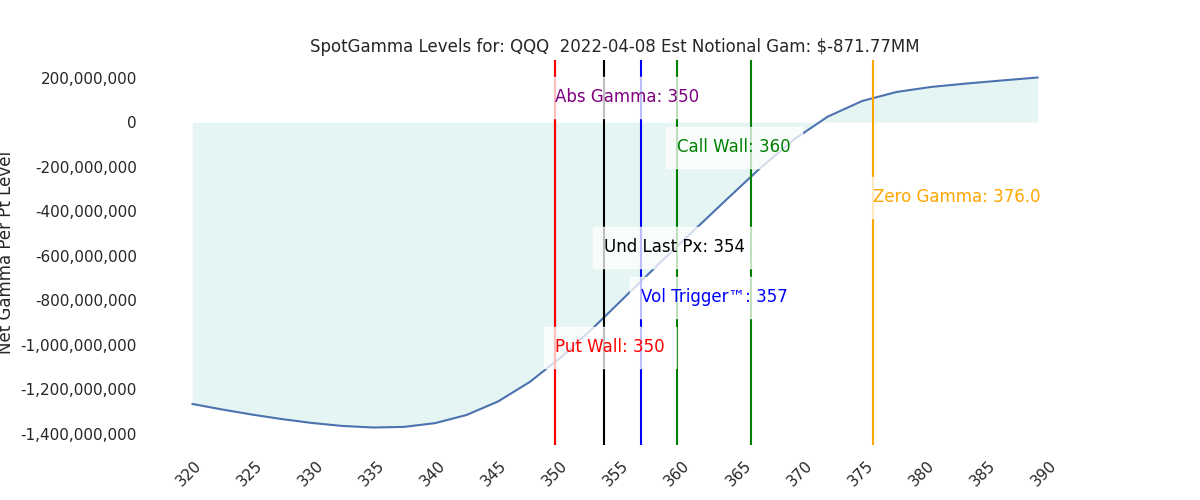
| Volatility Trigger™: | 4475 | 4475 | 449 | 14050 | 357 |
| SpotGamma Absolute Gamma Strike: | 4500 | 4500 | 450 | 14225 | 350 |
| Gamma Notional(MM): | -178.0 | -150.68 | -1303.0 | 5.0 | -872.0 |
| Additional Key Levels | Latest Data | Previous | SPY | NDX | QQQ |
|---|---|---|---|---|---|
| Zero Gamma Level: | 4529 | 4529 | 0 | 0 | 0 |
| Put Wall Support: | 4300 | 4300 | 440 | 14000 | 350 |
| Call Wall Strike: | 4600 | 4600 | 460 | 14225 | 360 |
| CP Gam Tilt: | 1.0 | 0.9 | 0.65 | 1.43 | 0.57 |
| Delta Neutral Px: | 4477 | ||||
| Net Delta(MM): | $1,349,666 | $1,342,814 | $168,414 | $47,583 | $107,342 |
| 25D Risk Reversal | -0.08 | -0.08 | -0.08 | -0.09 | -0.08 |
| Call Volume | 209,127 | 2,170,100 | 4,931 | 1,015,853 | |
| Put Volume | 499,969 | 2,674,311 | 10,996 | 1,313,086 | |
| Call Open Interest | 4,210,033 | 5,472,512 | 46,498 | 3,288,580 | |
| Put Open Interest | 8,728,905 | 12,307,822 | 51,664 | 7,126,072 |
| Key Support & Resistance Strikes: |
|---|
| SPX: [4600, 4550, 4500, 4400] |
| SPY: [450, 448, 445, 440] |
| QQQ: [360, 355, 350, 345] |
| NDX:[15000, 14500, 14225, 14000] |
| SPX Combo (strike, %ile): [4599.0, 4451.0, 4550.0, 4410.0, 4401.0] |
| SPY Combo: [458.64, 443.83, 453.71, 439.79, 438.9] |
| NDX Combo: [14227.0, 14357.0, 14154.0, 14575.0, 14285.0] |
0 comentarios