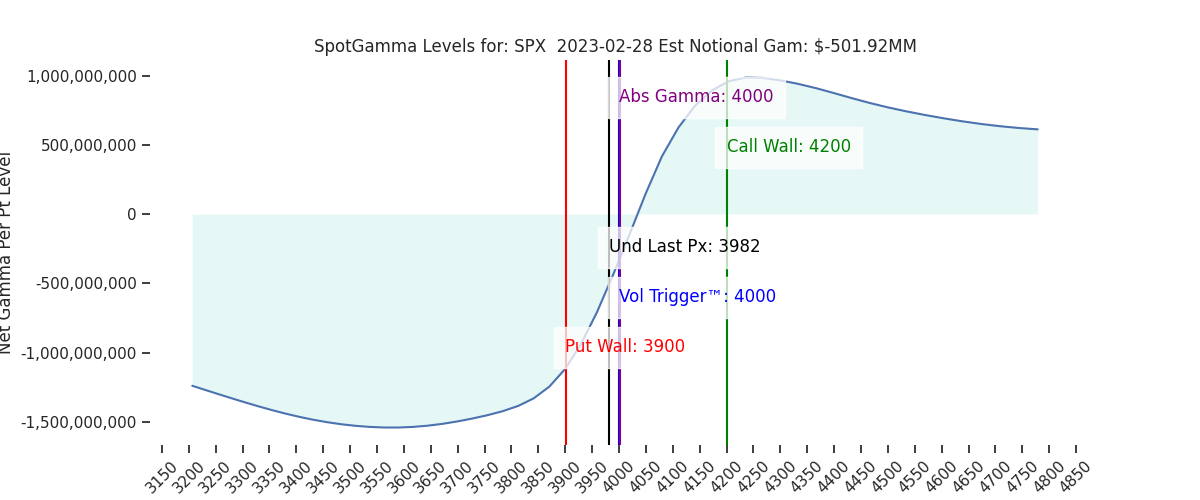
Futures are up reverted back to 4000 from overnight lows of 3972. Key SG levels were unchanged overnight, with 4000-4015 (400 SPY) as the pivot area, and initial overhead resistance. Resistance above this line is 4050, with support at 3974, then 3950.
It’s important to keep some context around the 4000 level, which is (and has been for months) the strike with the largest amount of S&P gamma. Through our options lens it’s a natural point of equilibrium, as various hedging flows may center around this strike.
Further, these 4000 strike positions don’t start to roll off until we have large quarterly expirations, like March 17th wherein ~120k of put & call OI each expire.
As a point, recall back to that Feb OPEX 4100 area call positioning that which sat on top of the larger, longer dated 4000 strike gamma. Once OPEX removed those calls the market drifted back into the 4000 pin.

What’s needed is enough flow to force a push away from this equilibrium. This does not have to be options related flow, just something to break that 4000 strike pull. What we have been noticing is that as the market shifts away, large 0DTE flows come in with deltas that push the market back toward 4000. This is what we saw on Friday with large positive market deltas on weakness, and yesterday with large negative deltas on market strength. In addition there has been a buildup of shorter term positions around the 400SPY/4000SPX strike which we feel adds support/reduces volatility in the 3950-4000 area.
Anecdotally it feels like many are waiting for this point of equilibrium to break lower – and the bears have had a few chances of late. In line with this have been our discussions around implied volatility compressing at market highs, as was seen into Feb OPEX. Immediately following OPEX was a tick up in IV and aforementioned SPX decline into 4000. But clearly momentum/RV is stalling out, which is starting to drag implied volatility lower. Lower IV is a bullish development.
What’s unique about this is the lack of equity volatility seems to be in the face of higher rate volatility. After the 2/1 FOMC the 10 year rate has shifted from ~3.4% to ~3.9%. When the 10 year hit these levels in December & October, the S&P was down toward the 3800 area.
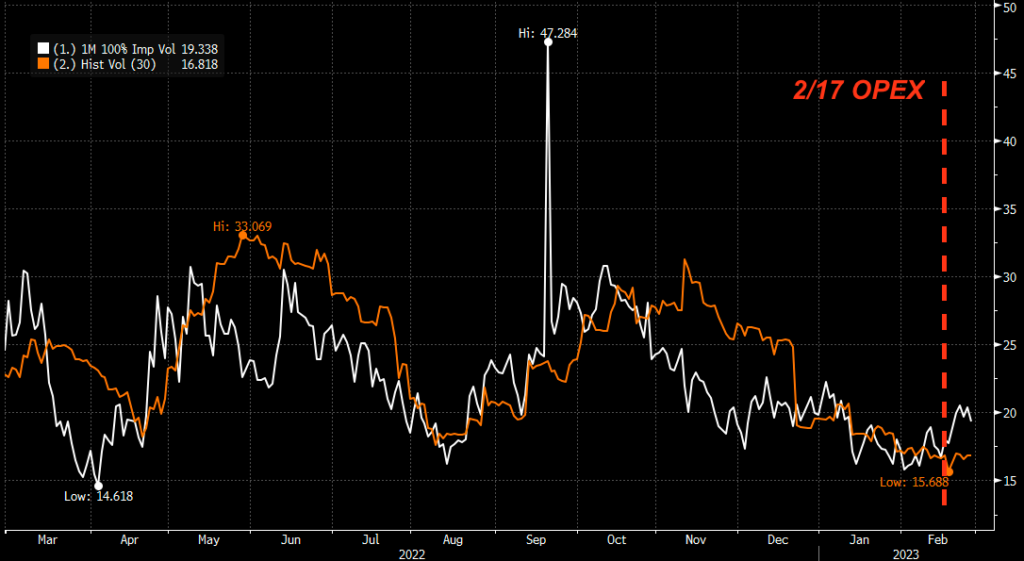
Shown below is the MOVE index (green), which is higher as a result of higher rates. This is plotted against the 30 day SPX RV (orange), and as you can see there is a correlation between higher rate volatility and higher equity volatility. This correlation seems to currently be behaving a bit strangely, as one could argue that equity volatility should be more responsive here.

| SpotGamma Proprietary SPX Levels | Latest Data | SPX Previous | SPY | NDX | QQQ |
|---|---|---|---|---|---|
| Ref Price: | 3982 | 3986 | 397 | 12057 | 293 |
| SG Implied 1-Day Move:: | 0.98%, | (±pts): 39.0 | VIX 1 Day Impl. Move:1.32% | ||
| SG Implied 5-Day Move: | 2.7% | 3970 (Monday Ref Price) | Range: 3863.0 | 4077.0 | ||
| SpotGamma Gamma Index™: | -0.61 | -1.07 | -0.43 | 0.04 | -0.11 |
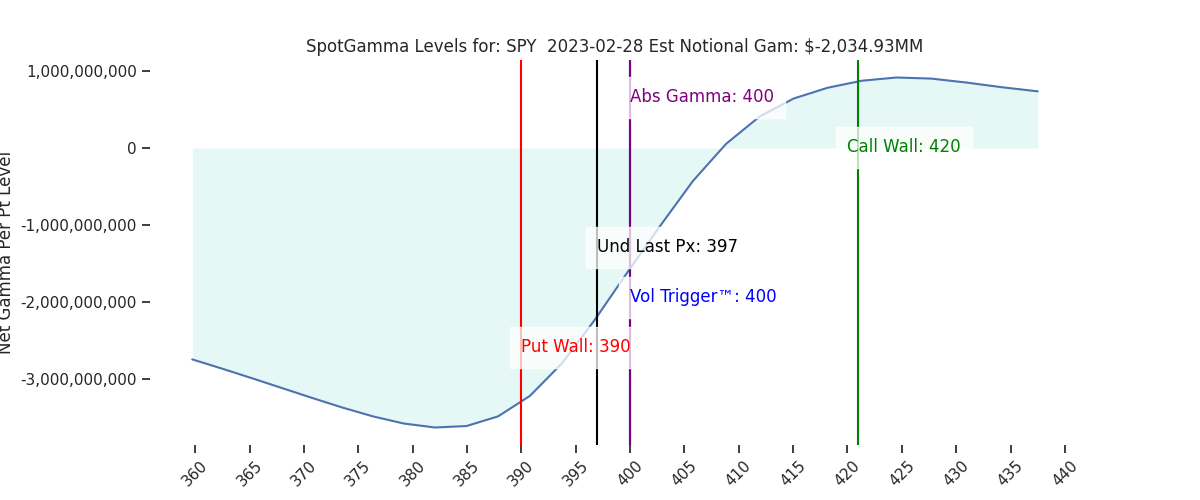
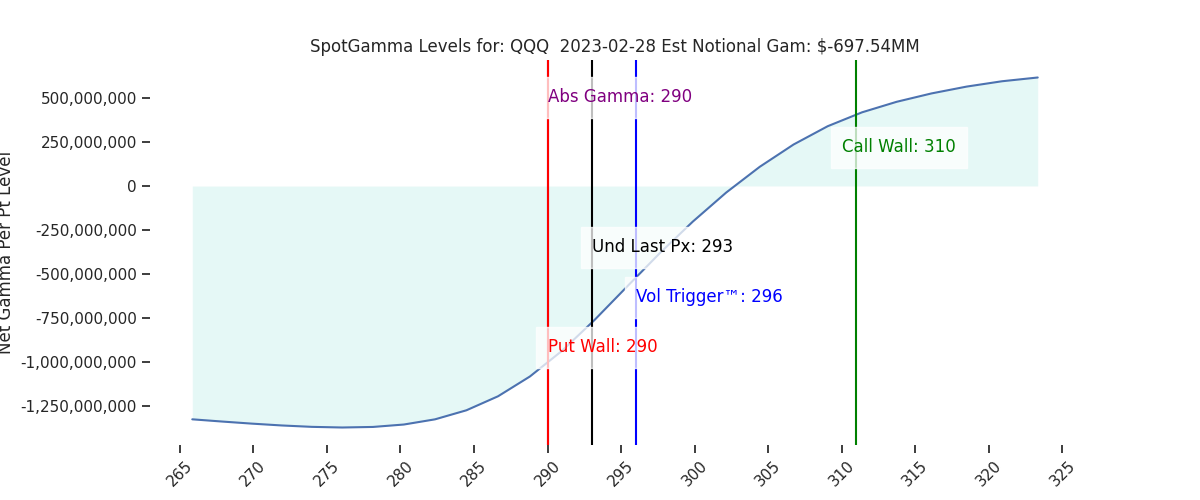
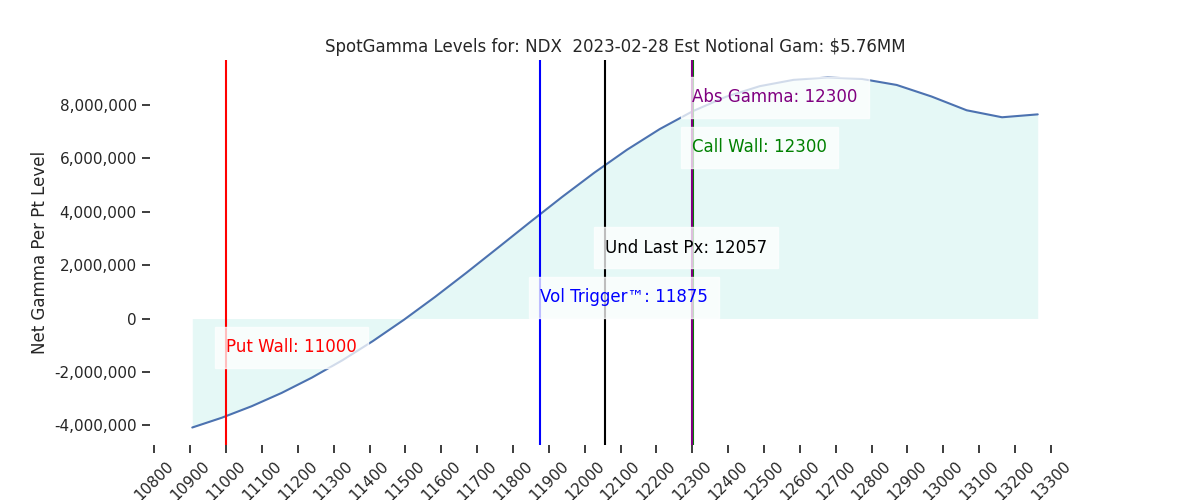
| Volatility Trigger™: | 4000 | 4000 | 400 | 11875 | 296 |
| SpotGamma Absolute Gamma Strike: | 4000 | 4000 | 400 | 12300 | 290 |
| Gamma Notional(MM): | -502.0 | -376.0 | -2035.0 | 6.0 | -698.0 |
| Put Wall: | 3900 | 3900 | 390 | 11000 | 290 |
| Call Wall : | 4200 | 4200 | 420 | 12300 | 310 |
| Additional Key Levels | Latest Data | Previous | SPY | NDX | QQQ |
|---|---|---|---|---|---|
| Zero Gamma Level: | 4029 | 4034 | 406.0 | 11506.0 | 312 |
| CP Gam Tilt: | 0.88 | 0.84 | 0.58 | 1.45 | 0.66 |
| Delta Neutral Px: | 3979 | ||||
| Net Delta(MM): | $1,504,285 | $1,564,903 | $180,746 | $48,017 | $95,709 |
| 25D Risk Reversal | -0.06 | -0.07 | -0.05 | -0.05 | -0.05 |
| Call Volume | 524,498 | 555,286 | 1,950,250 | 5,599 | 540,716 |
| Put Volume | 918,962 | 1,055,354 | 3,166,414 | 13,169 | 860,794 |
| Call Open Interest | 6,055,070 | 5,887,708 | 6,240,342 | 62,028 | 4,741,263 |
| Put Open Interest | 10,835,726 | 10,964,633 | 12,932,411 | 60,406 | 8,206,247 |
| Key Support & Resistance Strikes: |
|---|
| SPX: [4050, 4000, 3950, 3900] |
| SPY: [400, 398, 395, 390] |
| QQQ: [300, 295, 290, 285] |
| NDX:[13000, 12300, 12000, 11500] |
| SPX Combo (strike, %ile): [(4149.0, 87.41), (4102.0, 84.3), (4074.0, 78.25), (4066.0, 90.14), (4050.0, 81.27), (4030.0, 81.58), (4026.0, 85.2), (3998.0, 82.01), (3974.0, 81.52), (3954.0, 87.67), (3950.0, 96.46), (3946.0, 79.31), (3934.0, 82.01), (3926.0, 90.74), (3915.0, 77.05), (3907.0, 92.45), (3899.0, 97.37), (3875.0, 84.1), (3855.0, 83.61), (3851.0, 91.74), (3803.0, 80.43), (3799.0, 95.64)] |
| SPY Combo: [389.38, 394.55, 379.43, 390.17, 384.6] |
| NDX Combo: [12299.0, 11901.0, 11696.0, 11491.0, 11973.0] |