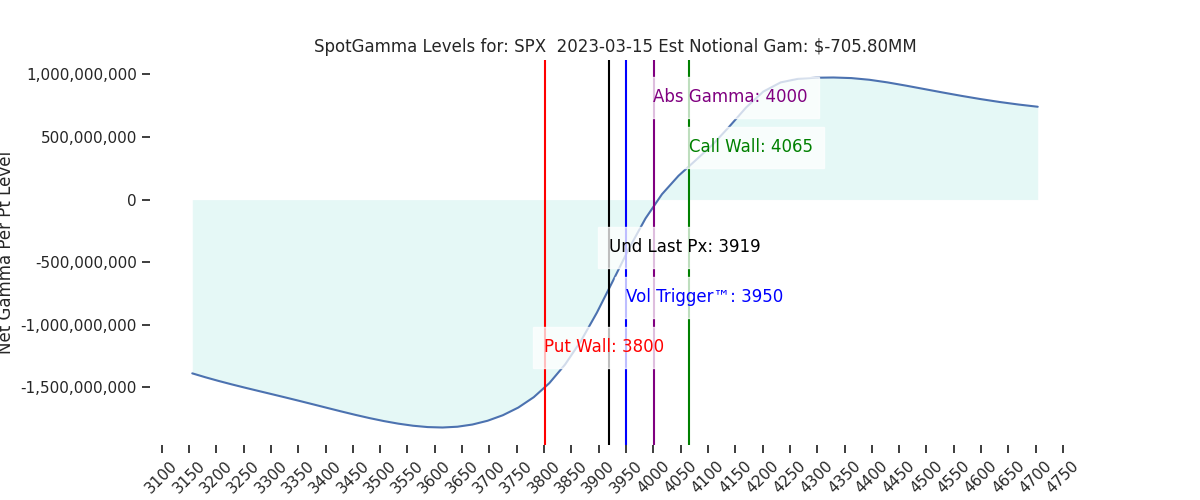
Futures have moved sharply lower, to 3900. The decline in futures appears to be triggered by concerns with European banks. The ES near 3900 implies that the S&P will open at 3850, our first support level. Below there, our most critical support level remains at the 3800 Put Wall, with resistance above at 3900.
Implied vols came down after yesterdays CPI, and the S&P staged a brief rally up to 3935. At the 3950 strike we saw large call volumes of +105k, along with +70k calls at 4000. This flow, we believe, was predominantly call selling. Further, we saw an additional +200k in total volume at the 3900 strike which continues to establish large gamma at this level.
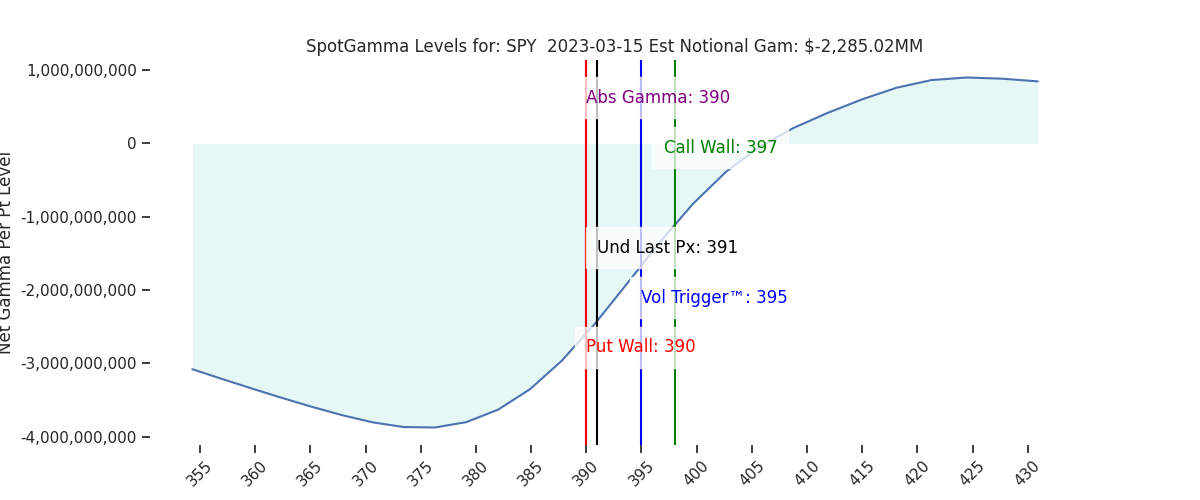
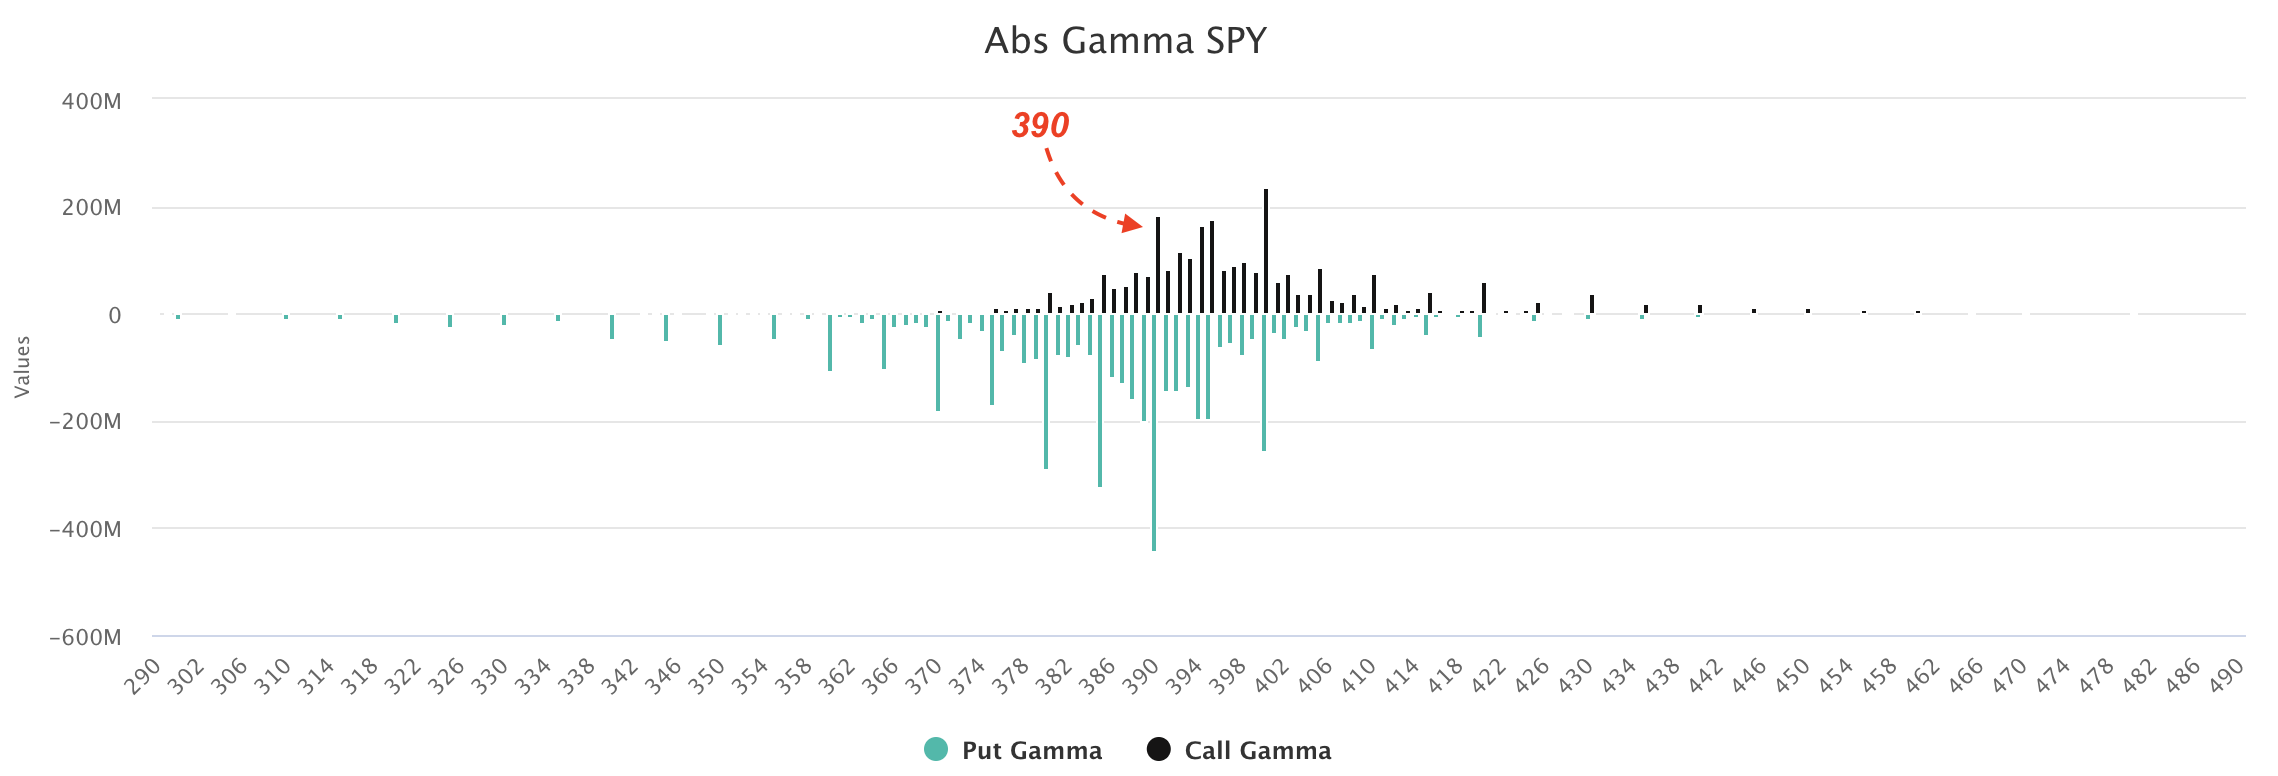
This 390 positioning is particularly apparent in SPY, as shown below. Accordingly, this 390 SPY/3900 SPX is now stronger resistance. Further, note that the area from 390-400 now holds fairly large call positions (black bars). This, in line with our remarks above, implies more resistance and/or a slowing of volatility in the 390/3900-400/4000 range.
Turning to downside risks, traders may focus more on credit markets. The concern here is that it is with credit risk, and related hedging, that can lead to incremental demand for equity put protection. This is the type of scenario that drives large drops in markets, and the VIX +40.
Shown here is the 5 year CDS on Credit Suisse, which is jumping higher.

This type of bank stress, combined with the focus on inflation, is creating uncertainty around interest rates. Not just from views on the Fed’s policy, but additionally the record rate volatility as we’ve seen over the last few days. All of this has the MOVE index at levels not seen since the ’08 crisis.

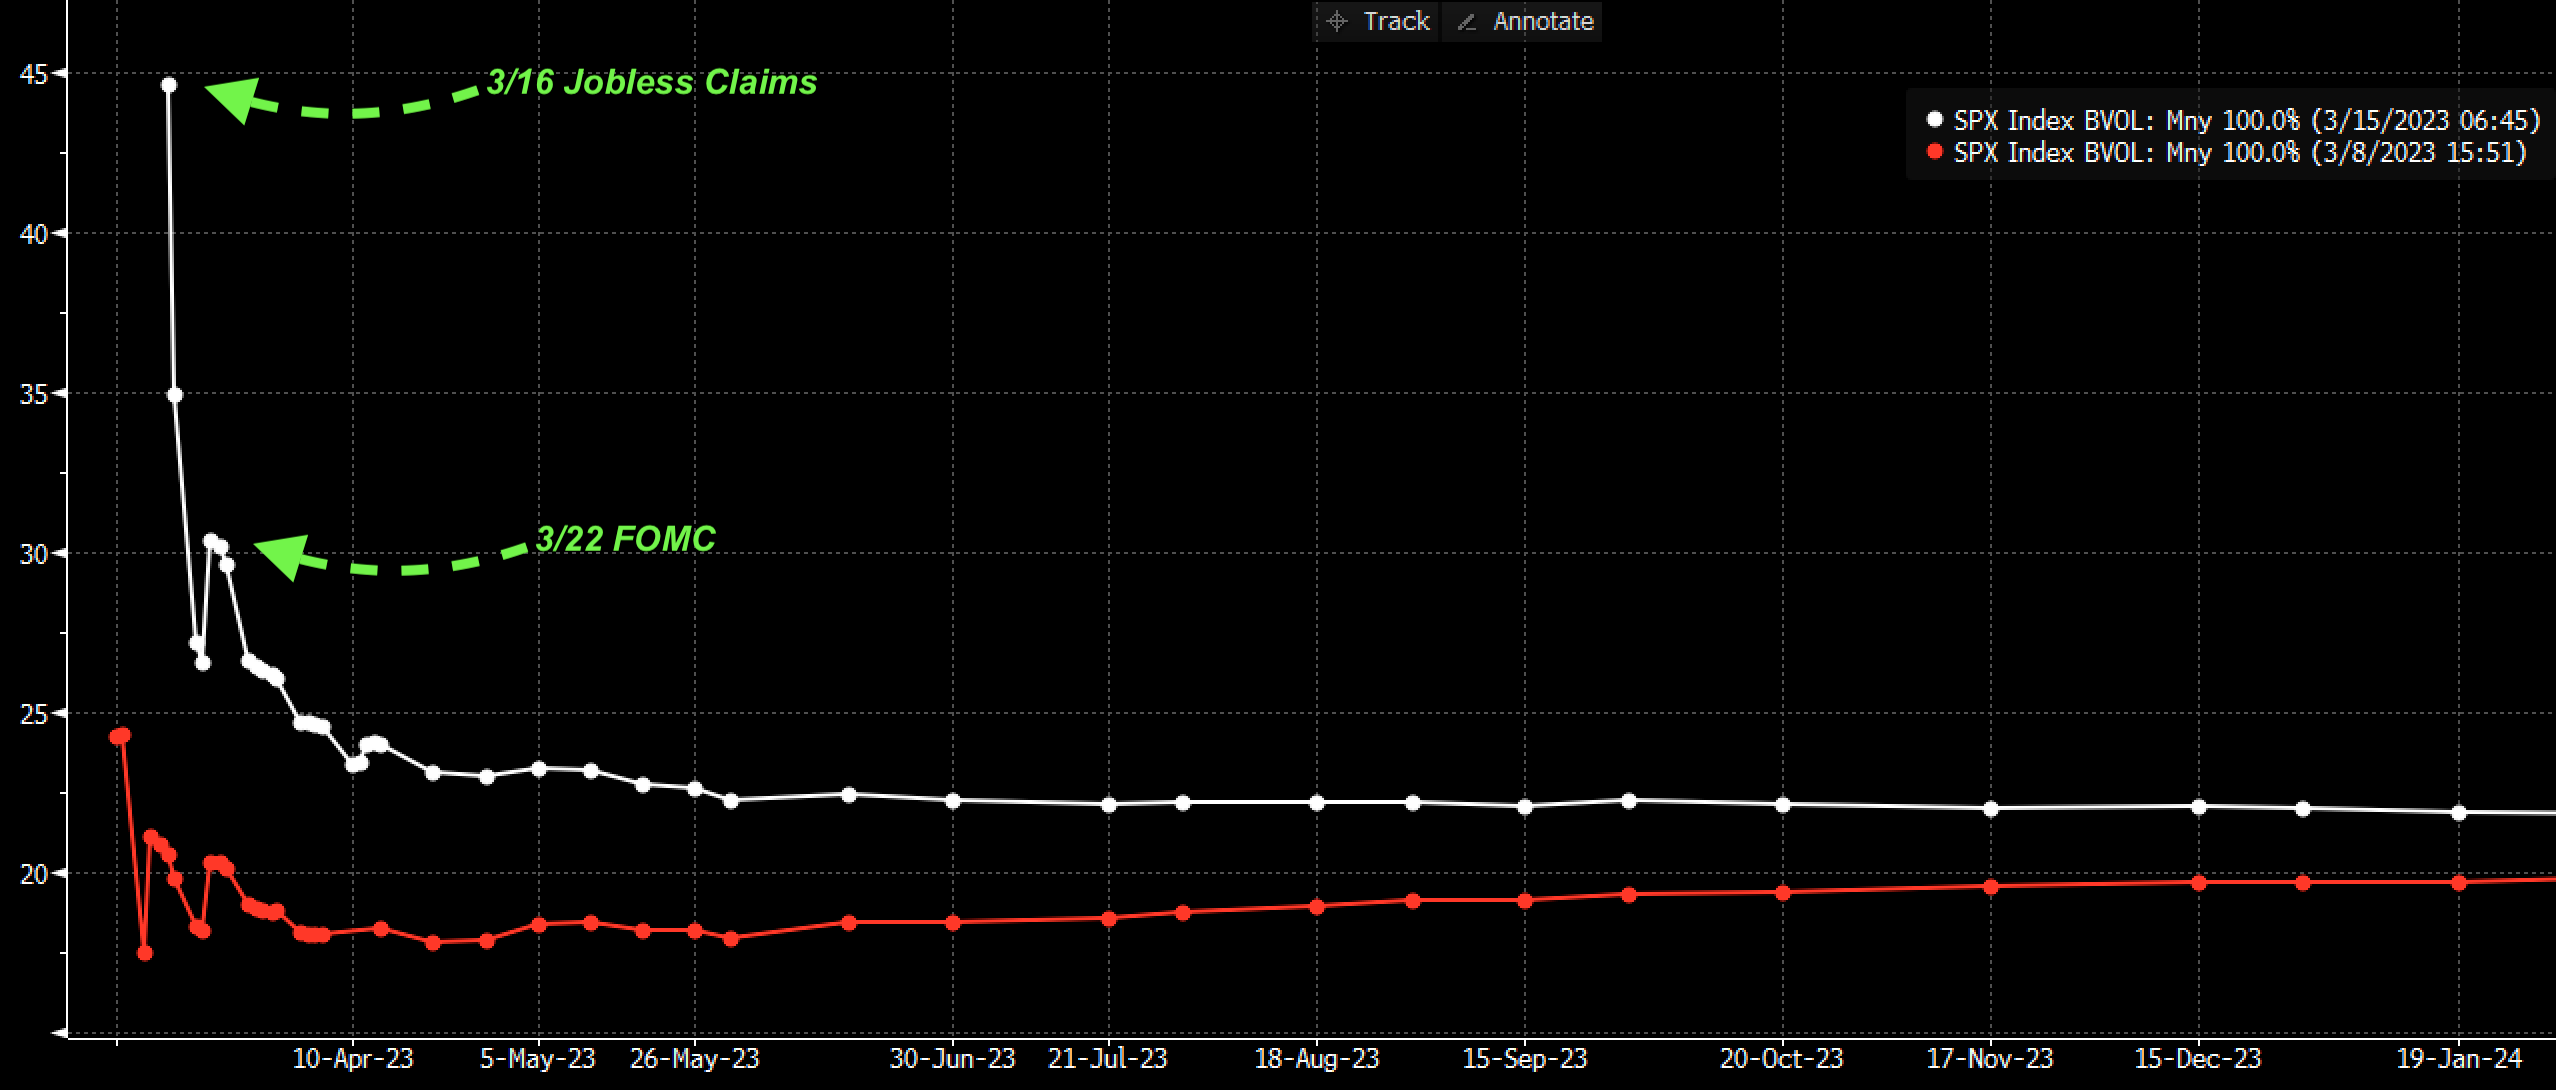
For our purposes, this all suggests that options implied volatility should remain quite elevated, at least in through 3/22 FOMC. Elevated IV is obviously the current situation, as shown below in SPX term structure. While there remains elevated “event volatility” around various data points like tomorrows Jobless Claims, we think the macro stresses are likely to place even more focus on Fed policy. In other words, traders were hanging on every jobs/CPI/sales data point for predictive evidence of Fed policy – but now we have the added uncertainty of systemic stress. Short term IV relief is unlikely, which adds to downside risks.
This elevated implied volatility comes along with record VIX call open interest, and fairly large SPX put positions. Further, there is a high amount of gamma due to the close proximity of Fridays expiration. This all equates to large intraday swings. As a result, we hold a neutral view of markets in the 3800-3900, favoring mean reversion into large gamma strikes. We favor markets holding in this range.
Looking forward, we see 3950-4000 as major resistance into 3/17. Further, we think the market upside may be capped by 4065 into 3/31. This is due to the large 3/31 JPM collar call strike at 4065 – and we’d note that 4065 is now our Call Wall.
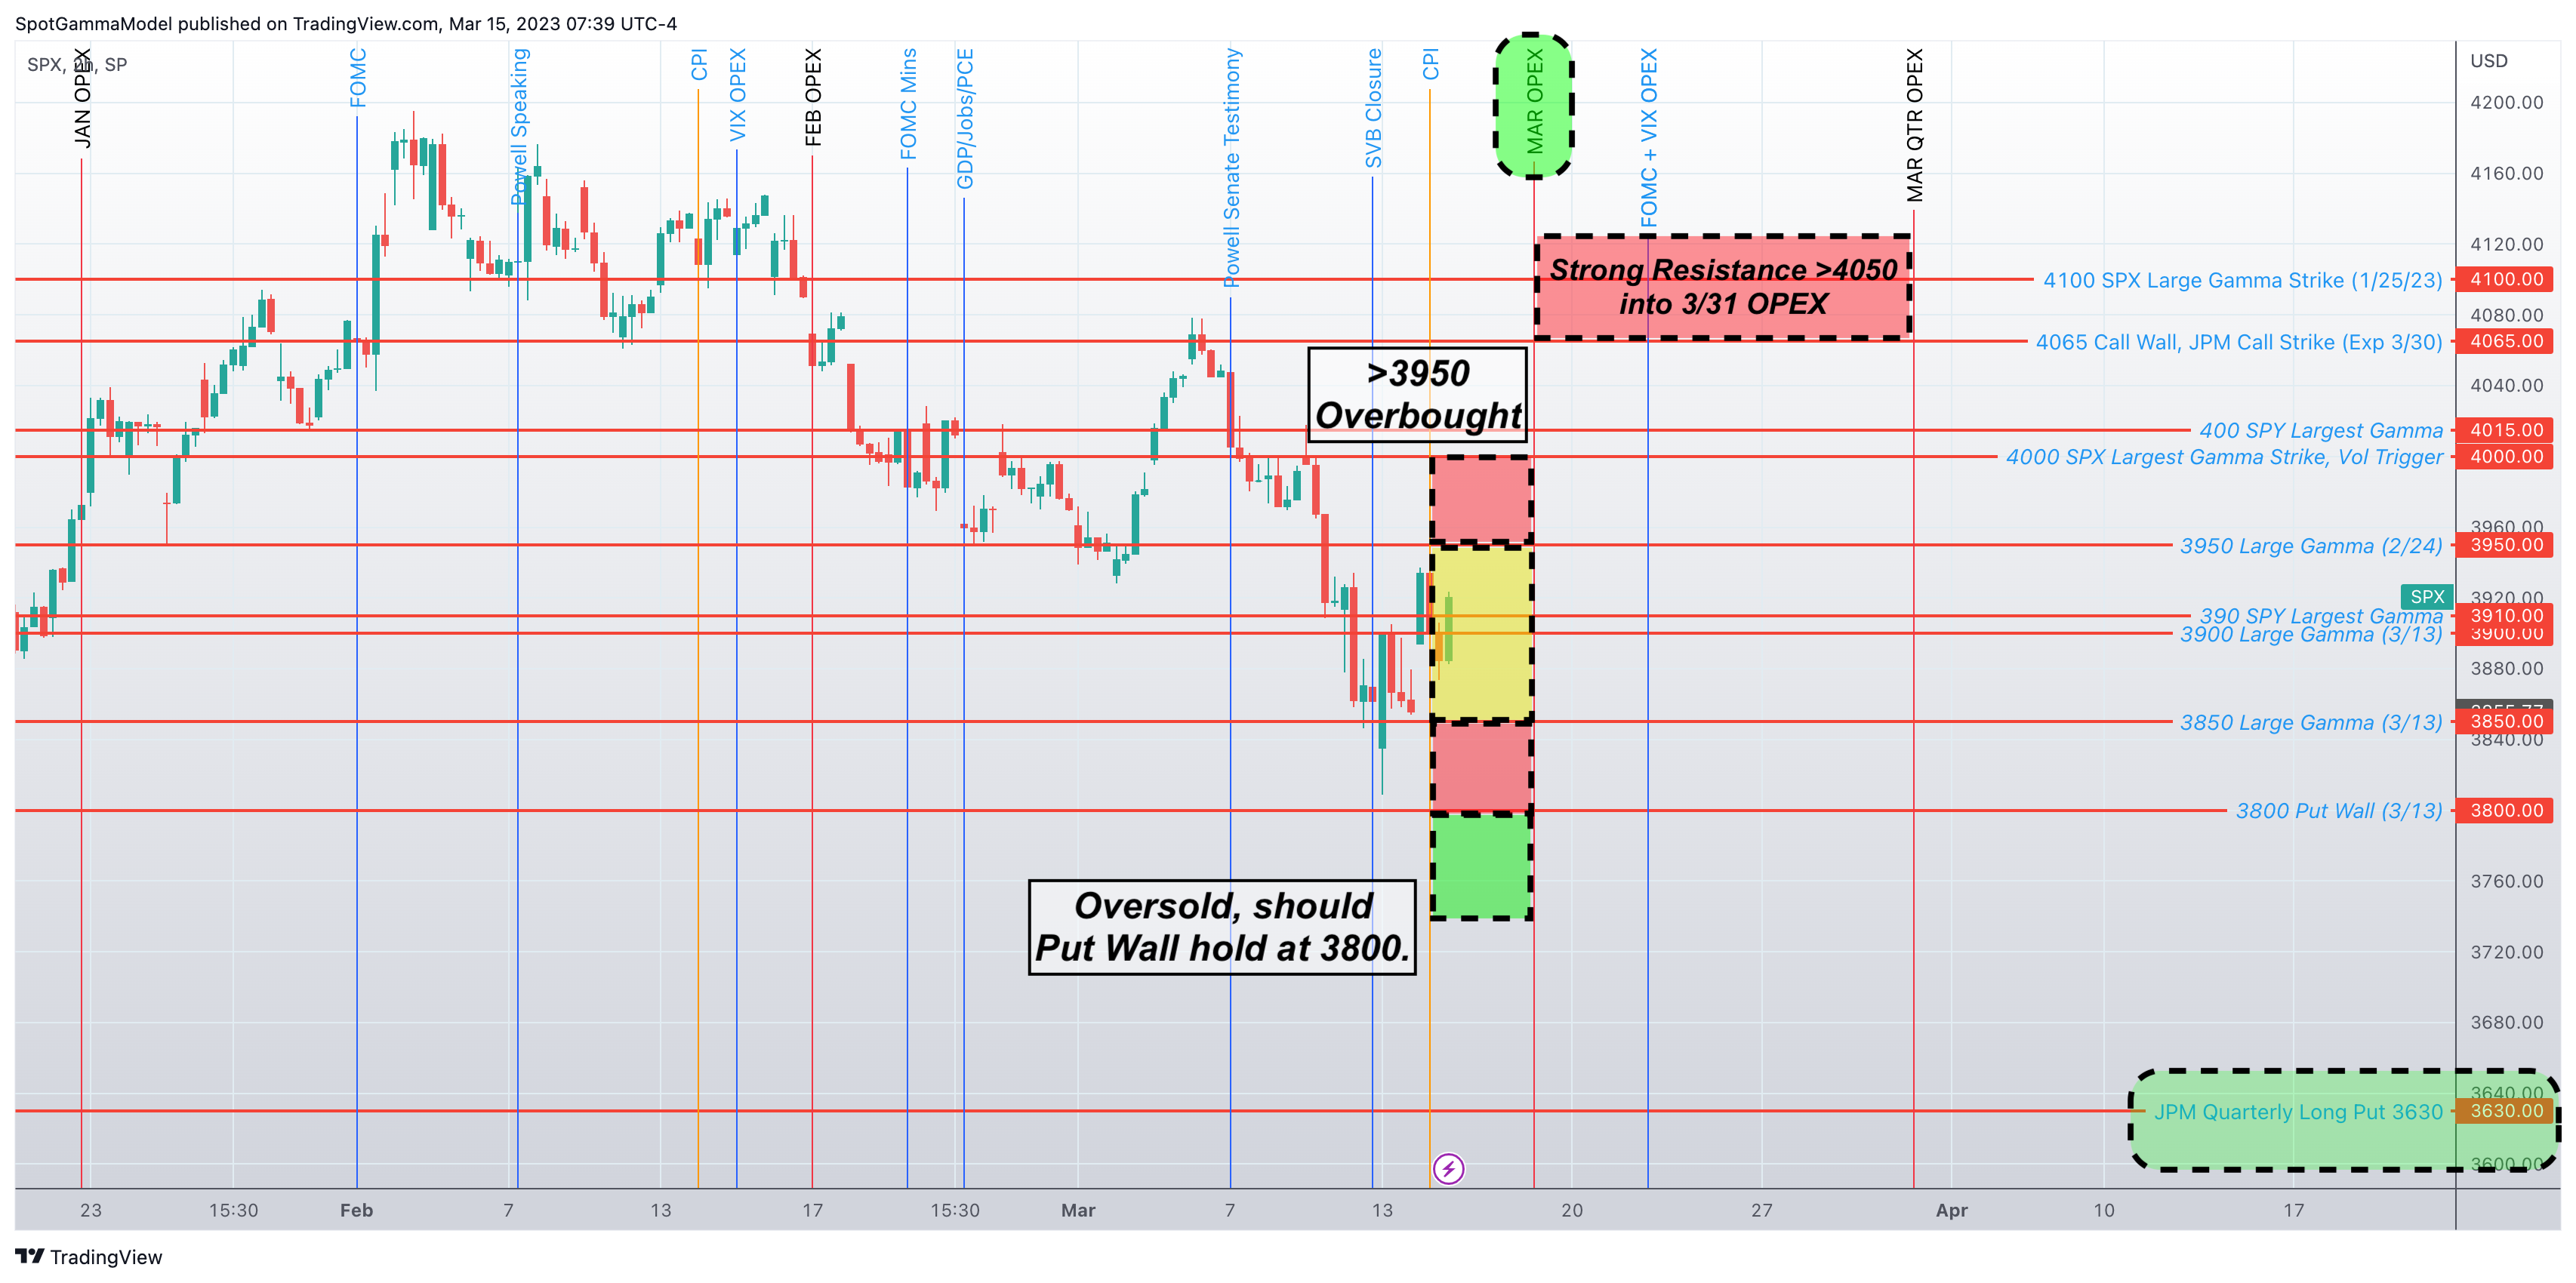
To the downside, a move below 3800 is considered oversold unless we see the Put Wall roll lower. The Put Wall rolling lower suggests traders have added larger downside put positions, which adds to gamma at strikes below.
If markets sell off into 3/17, the combination of large puts expiring and the passing of FOMC offer a strong chance for markets to rally into 3/31.
Should credit issues further materialize this week, and/or Powell delivers a blow to markets on 3/22, the clear “extreme downside” level to watch is 3630, as that is where the 3/31 JPM long collar put strike sits.
| SpotGamma Proprietary SPX Levels | Latest Data | SPX Previous | SPY | NDX | QQQ |
|---|---|---|---|---|---|
| Reference Price: | 3919 | 3905 | 391 | 12199 | 297 |
| SG Implied 1-Day Move: | 0.99%, | (±pts): 39.0 | VIX 1 Day Impl. Move:1.5% | ||
| SG Implied 5-Day Move: | 2.54% | 3861 (Monday Reference Price) | Range: 3764.0 | 3960.0 | ||
| SpotGamma Gamma Index™: | -1.28 | -1.84 | -0.49 | 0.08 | -0.07 |
| Volatility Trigger™: | 3950 | 3960 | 395 | 11840 | 295 |
| SpotGamma Absolute Gamma Strike: | 4000 | 4000 | 390 | 12300 | 300 |
| Gamma Notional (MM): | -706.0 | -550.0 | -2285.0 | 12.0 | -401.0 |
| Call Wall: | 4065 | 4200 | 397 | 12300 | 310 |
| Put Wall: | 3800 | 3800 | 390 | 11000 | 285 |
| Additional Key Levels | Latest Data | Previous | SPY | NDX | QQQ |
|---|---|---|---|---|---|
| Zero Gamma Level: | 4026 | 4071 | 406.0 | 11759.0 | 341 |
| Gamma Tilt: | 0.78 | 0.78 | 0.56 | 1.67 | 0.81 |
| Delta Neutral Px: | 3976 | ||||
| Net Delta (MM): | $1,627,778 | $1,504,549 | $210,496 | $55,469 | $107,224 |
| 25 Day Risk Reversal: | -0.06 | -0.05 | -0.07 | -0.05 | -0.06 |
| Call Volume: | 751,700 | 688,690 | 2,273,348 | 7,786 | 813,311 |
| Put Volume: | 1,162,768 | 1,261,221 | 3,668,593 | 7,046 | 1,144,257 |
| Call Open Interest: | 6,606,394 | 6,538,840 | 7,087,865 | 69,681 | 5,394,973 |
| Put Open Interest: | 11,938,499 | 11,145,032 | 14,310,859 | 71,231 | 8,780,716 |
| Key Support & Resistance Strikes: |
|---|
| SPX: [4000, 3950, 3900, 3850] |
| SPY: [400, 395, 390, 385] |
| QQQ: [300, 295, 290, 285] |
| NDX: [12500, 12300, 12200, 12000] |
| SPX Combo (Strike, Percentile): [(4065.0, 88.02), (3998.0, 89.84), (3951.0, 83.48), (3904.0, 87.55), (3900.0, 96.93), (3892.0, 76.97), (3888.0, 78.15), (3881.0, 75.52), (3873.0, 87.77), (3869.0, 81.19), (3861.0, 75.46), (3853.0, 90.93), (3849.0, 95.25), (3826.0, 89.17), (3802.0, 85.41), (3798.0, 98.72), (3775.0, 81.53), (3751.0, 75.77), (3747.0, 93.94)] |
| SPY Combo: [379.59, 389.77, 384.68, 374.49, 385.07] |
| NDX Combo: [12297.0, 11687.0, 11895.0, 12712.0, 12310.0] |