Macro Theme:
Major Resistance: $4,100 – $4,110 (SPY $410)
Pivot Level: $4,100
Critical Support: $4,000 Put Wall
Range High: $4,200
Range Low: $4,000 Put Wall
‣ We look for markets to consolidate after OPEX & heading into the 5/3 FOMC
Founder’s Note:
Futures are higher to 4100, with the Nasdaq up 70bps to 12,977. Once again positive earnings results are aiding futures, particularly from META (+15% premarket). SpotGamma’s key levels are largely unchanged, with key resistance at 4100 – 4110 (SPY 410), and support at 4060 (SPY 405) – 4050.
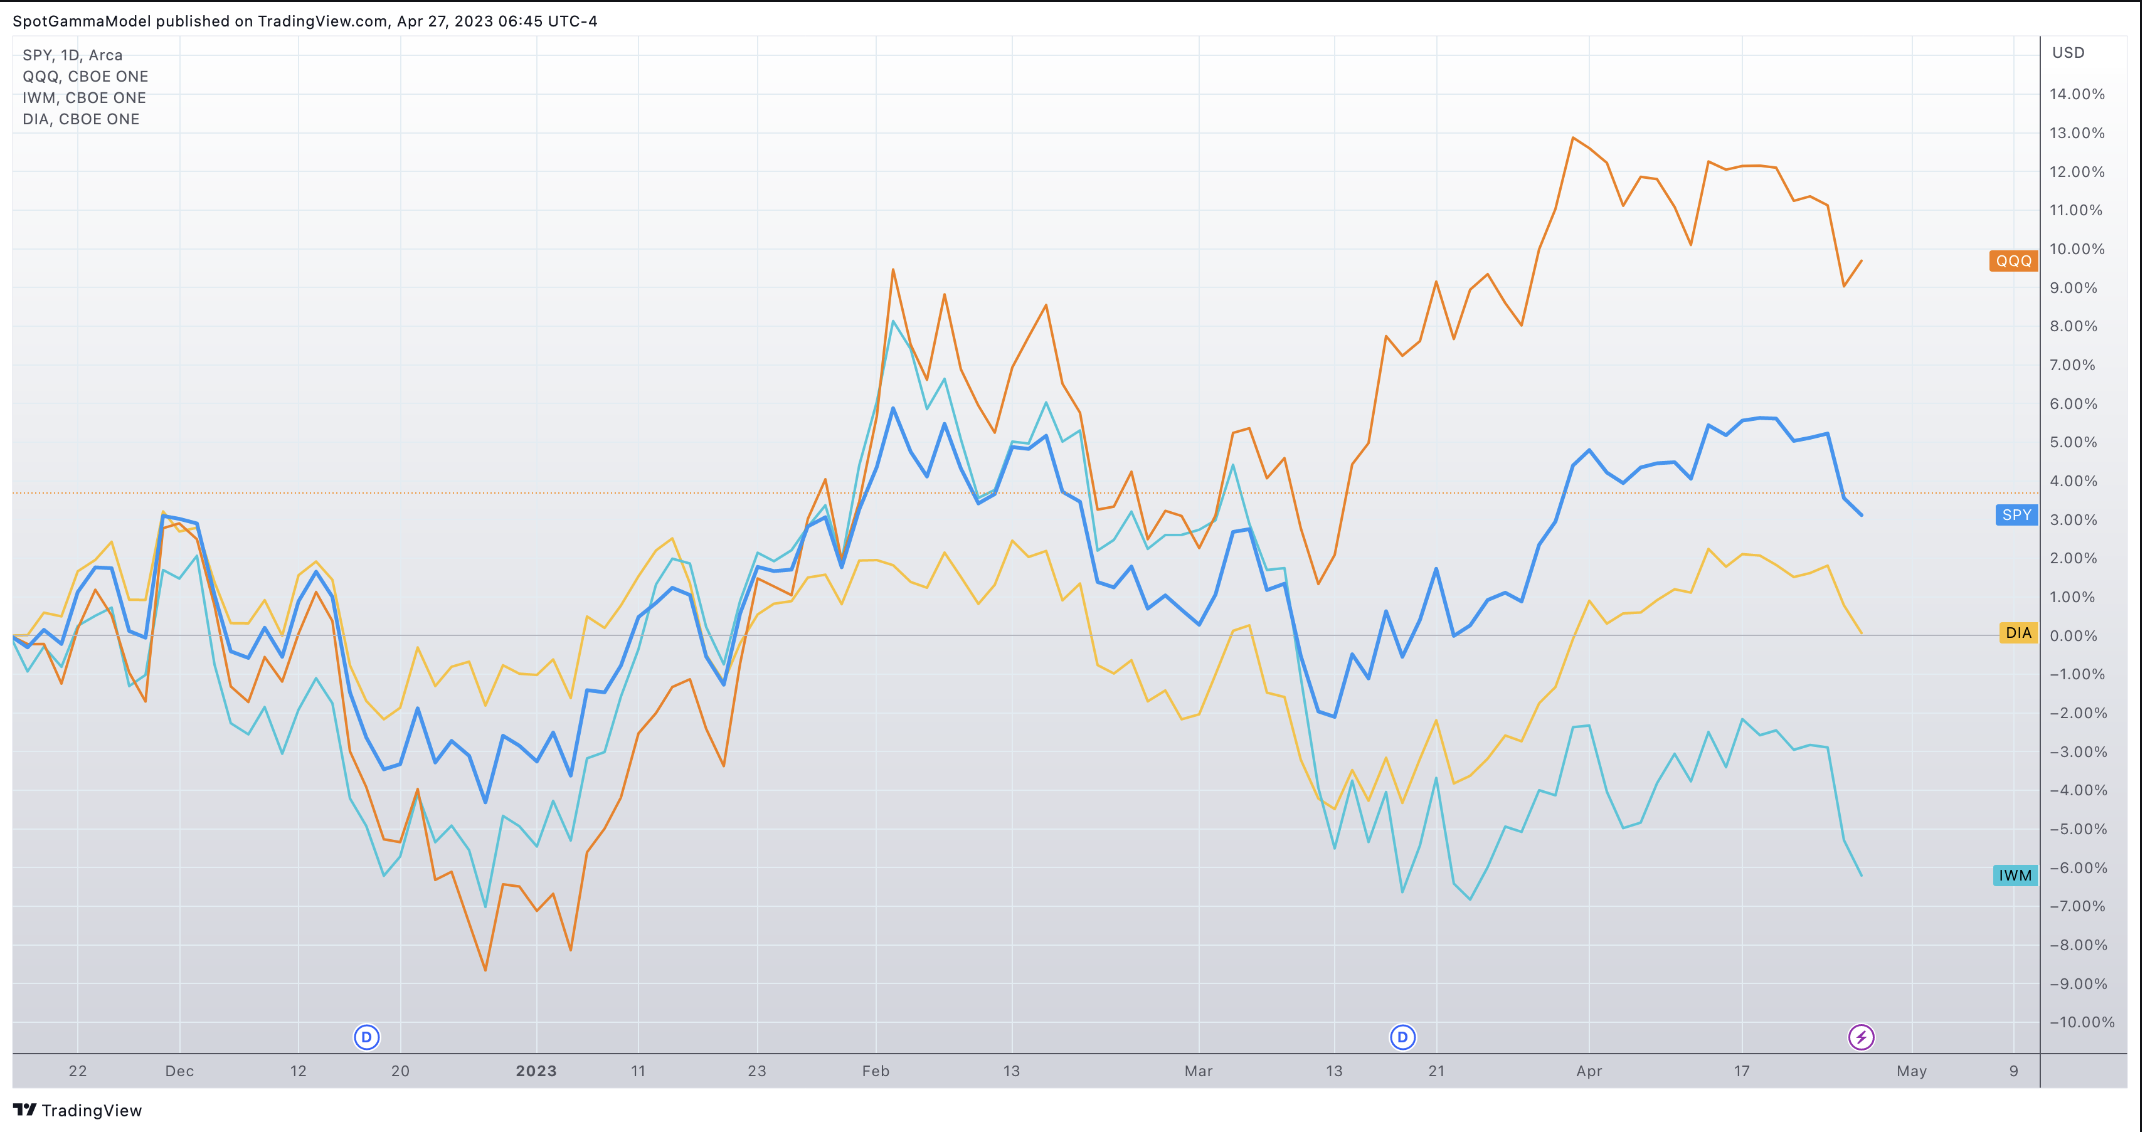
The tech outperformance continues to be impressive, as shown below. This dichotomy is particularly clear in recent days wherein several megacap tech names are +5-10% (or more), but issues like regional bank failures offset those gaines (FRC -60% since Monday’s ER). Added into downside pressure, we believe, was the window of weakness post-OPEX. We now see our short term downside targets as largely achieved with yesterdays test of 4050, and IV mean reversion from 1 year lows (i.e. VIX test of 20 from 16 last week).
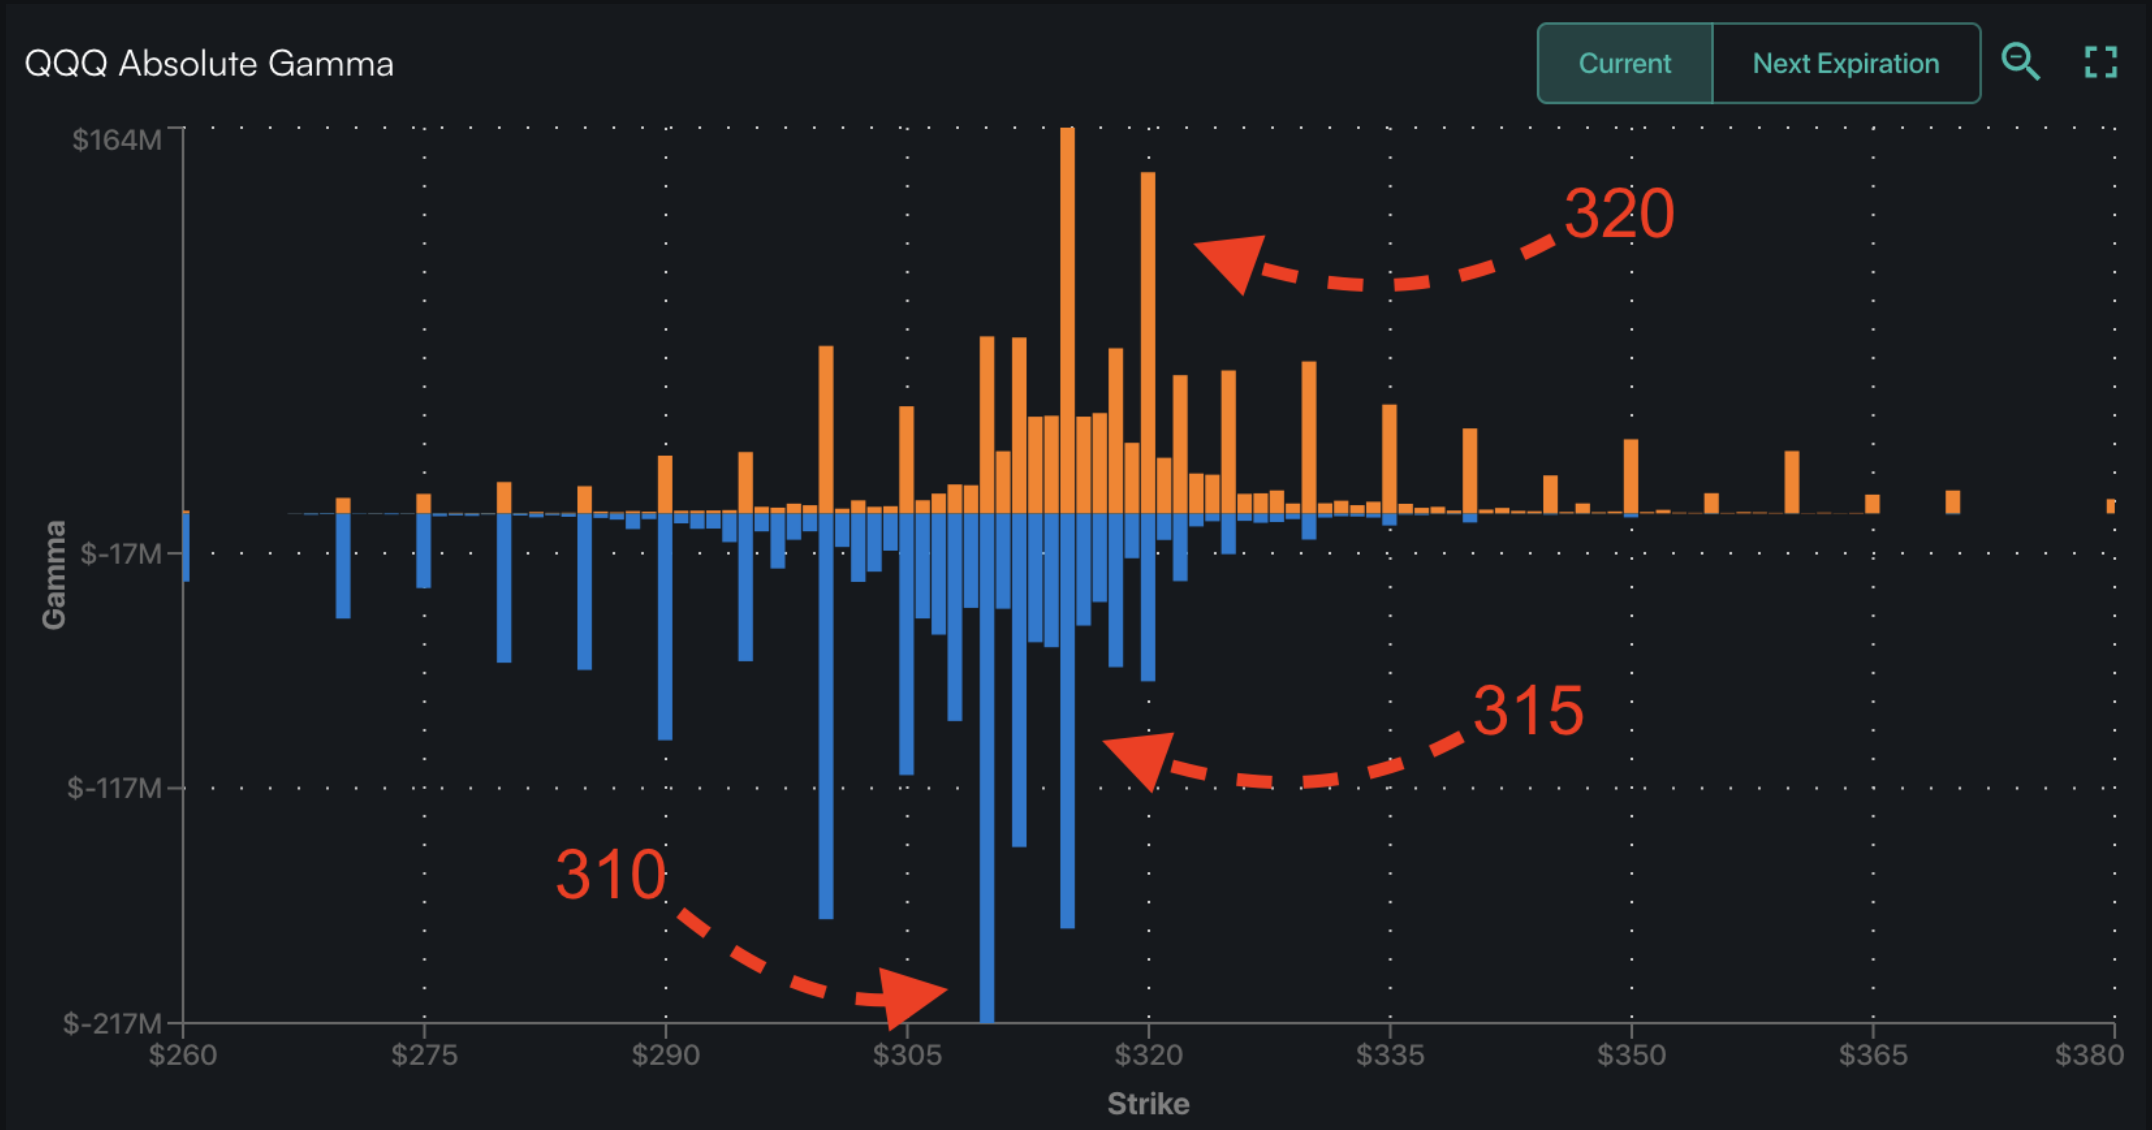
For today, we mark SPX with a clear short term range of 4050-4100, and there is also a clear range in QQQ. In QQQ there is a large gamma support bar down at 310 (Tuesday low), with a resistance line just overhead at 315 (yesterday’s high). Farther out in time our current range high is the 320 Call Wall, which has been at this level for several weeks. While we want to give edge to both SPX holding 4100 & QQQ holding 315 into FOMC, we are starting to come around to a bullish setup.
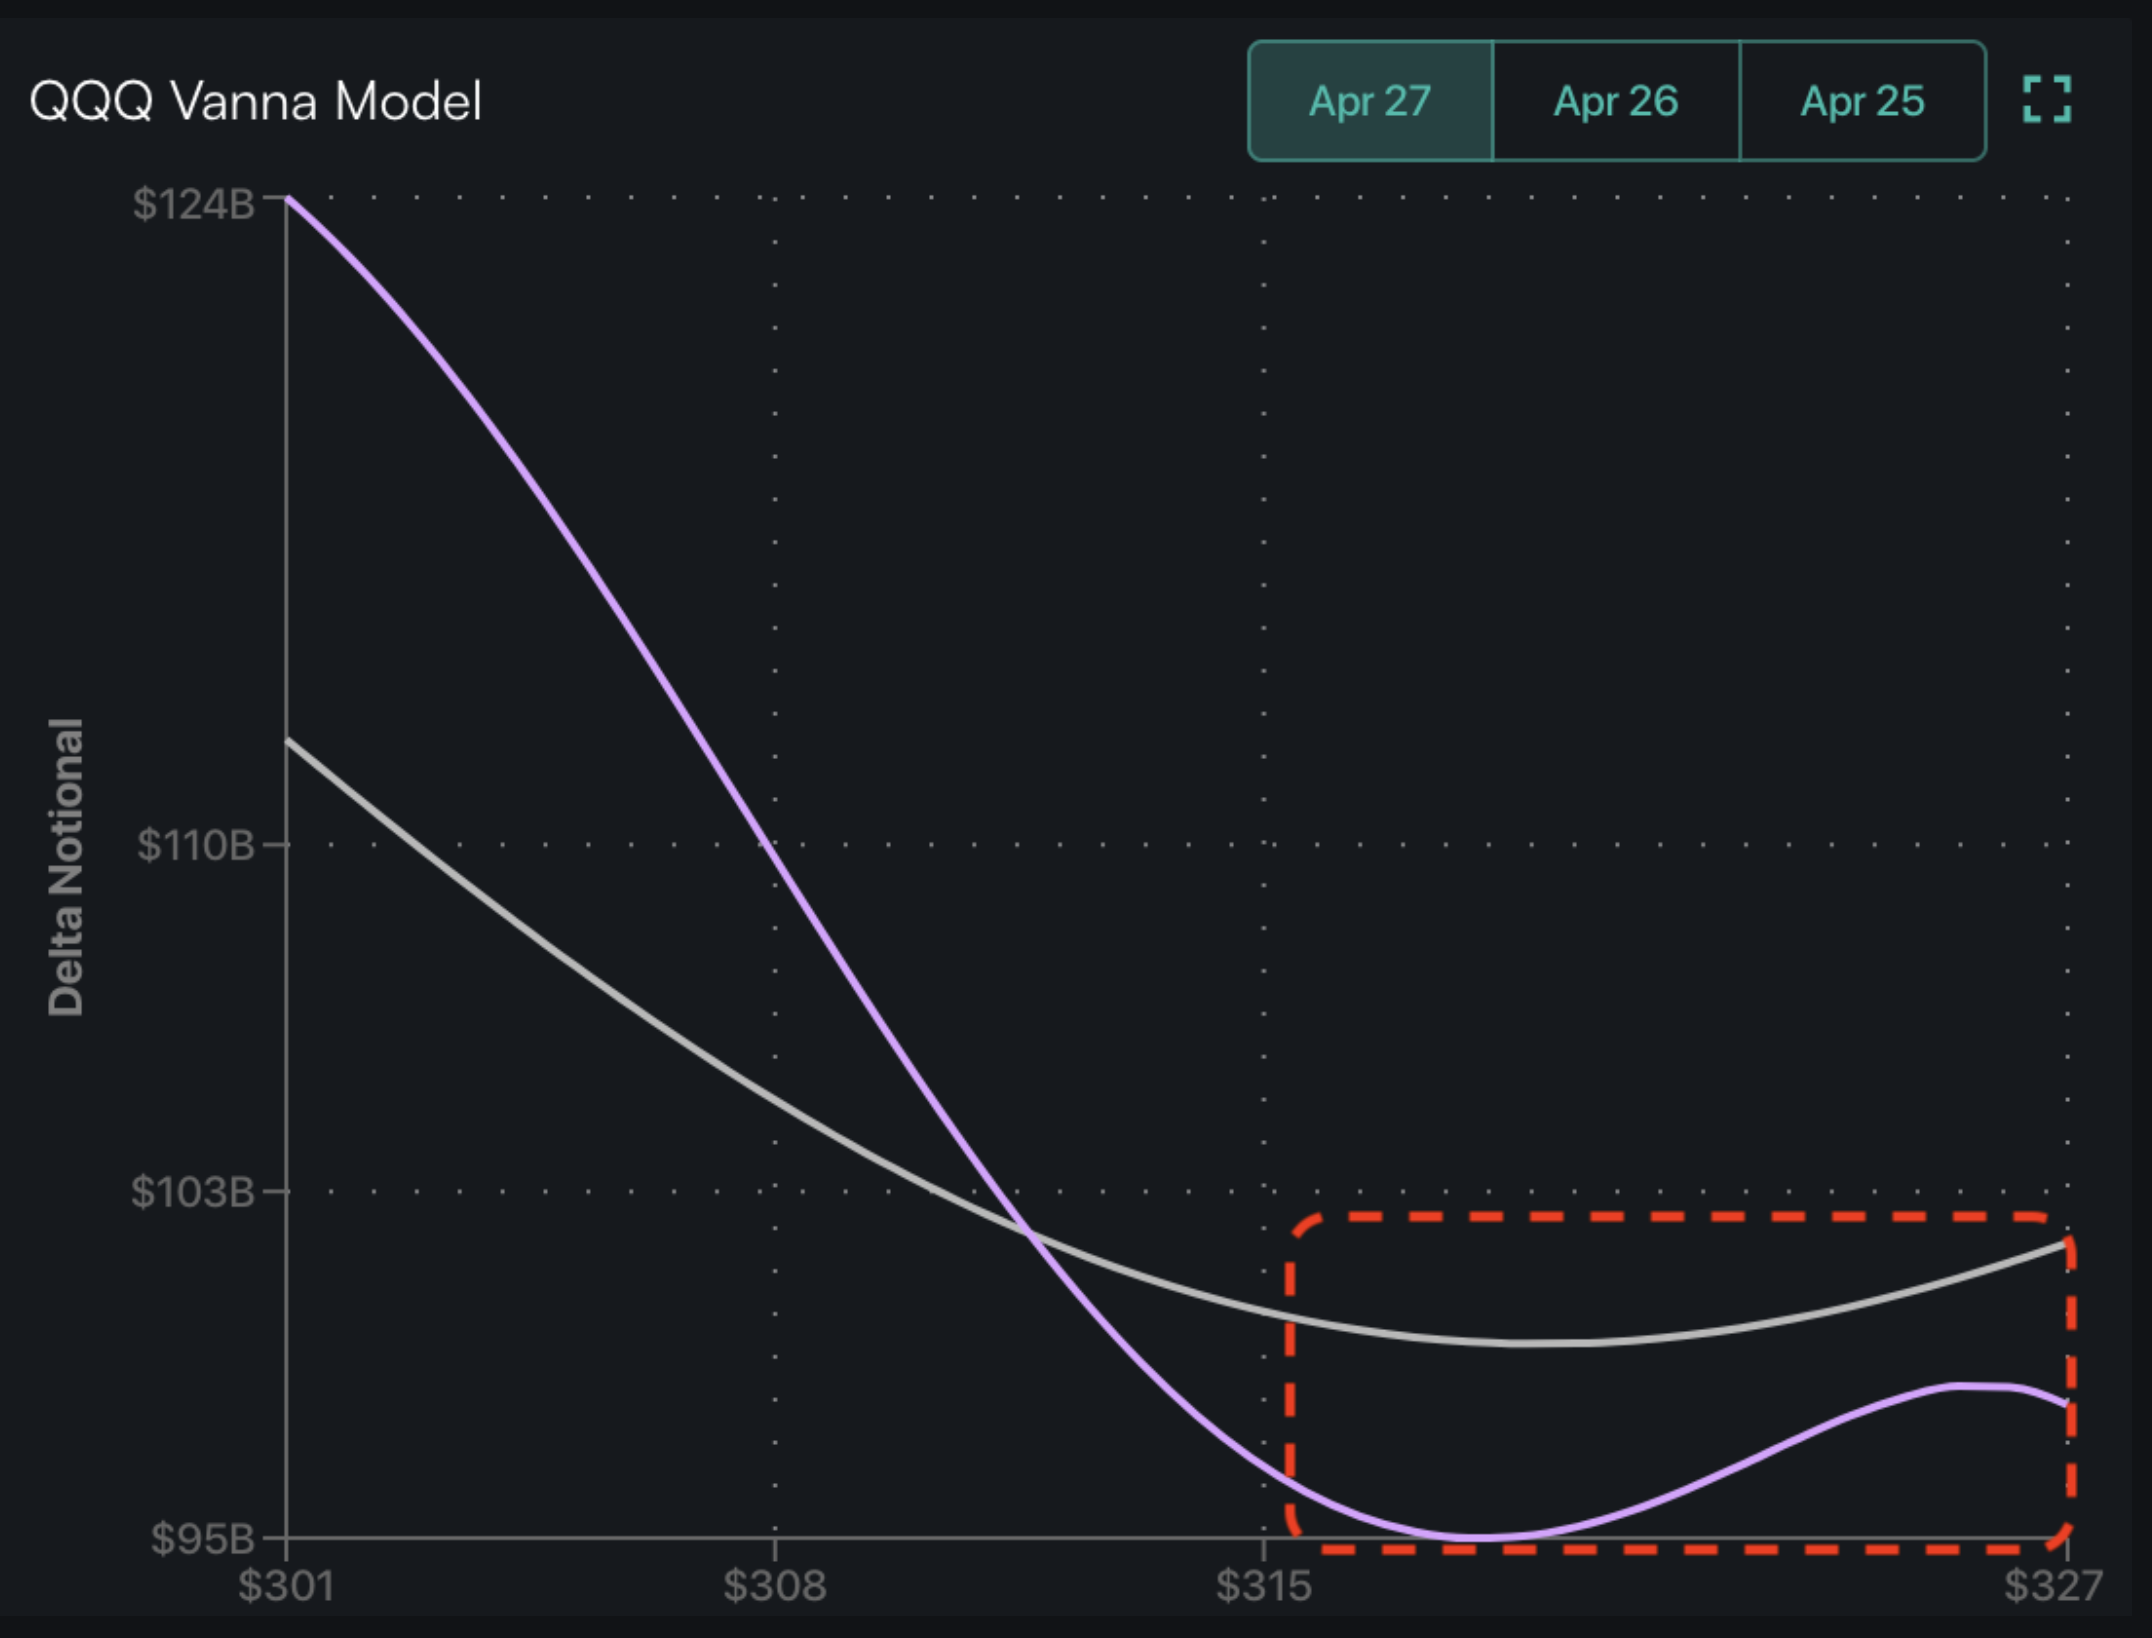
With the SPX index so concentrated in megacap tech (ex: MSFT + AAPL = 13% of SPX), one has to appreciate the upside pull these names are likely adding. Further, the ratcheting higher of IV provides some potential upside fuel for markets, should vol sellers step up. This setup can be seen in our vanna models, wherein our IV adjusted delta (purple) is lower than base delta (gray). This suggests options liquidity providers have less long exposure as markets rally which implies lower levels of hedges (ex: futures) to sell into rallies.
Narratives aside – calls are now “neutral-weight” (vs “call heavy” last week) and 1 month RV is down at 15 vs implied near 20. This gives vol sellers a bit of juice, and while we would bet they generally hold off on a full “vol smack down” until after 5/3 FOMC, it wouldn’t be surprising to see traders get more aggressive ahead of the Fed. This vol selling is reflexive in nature, and that could spark a more material IV decline ahead of 5/3.
From one perspective, the downside risks of regional banks/debt ceilings/recession are all lingering issues, but “tomorrow’s problems”. These risks were all apparent from March 17th OPEX to April 21st OPEX – a time in which IV was crushed to 1 year lows and markets hit recent highs.
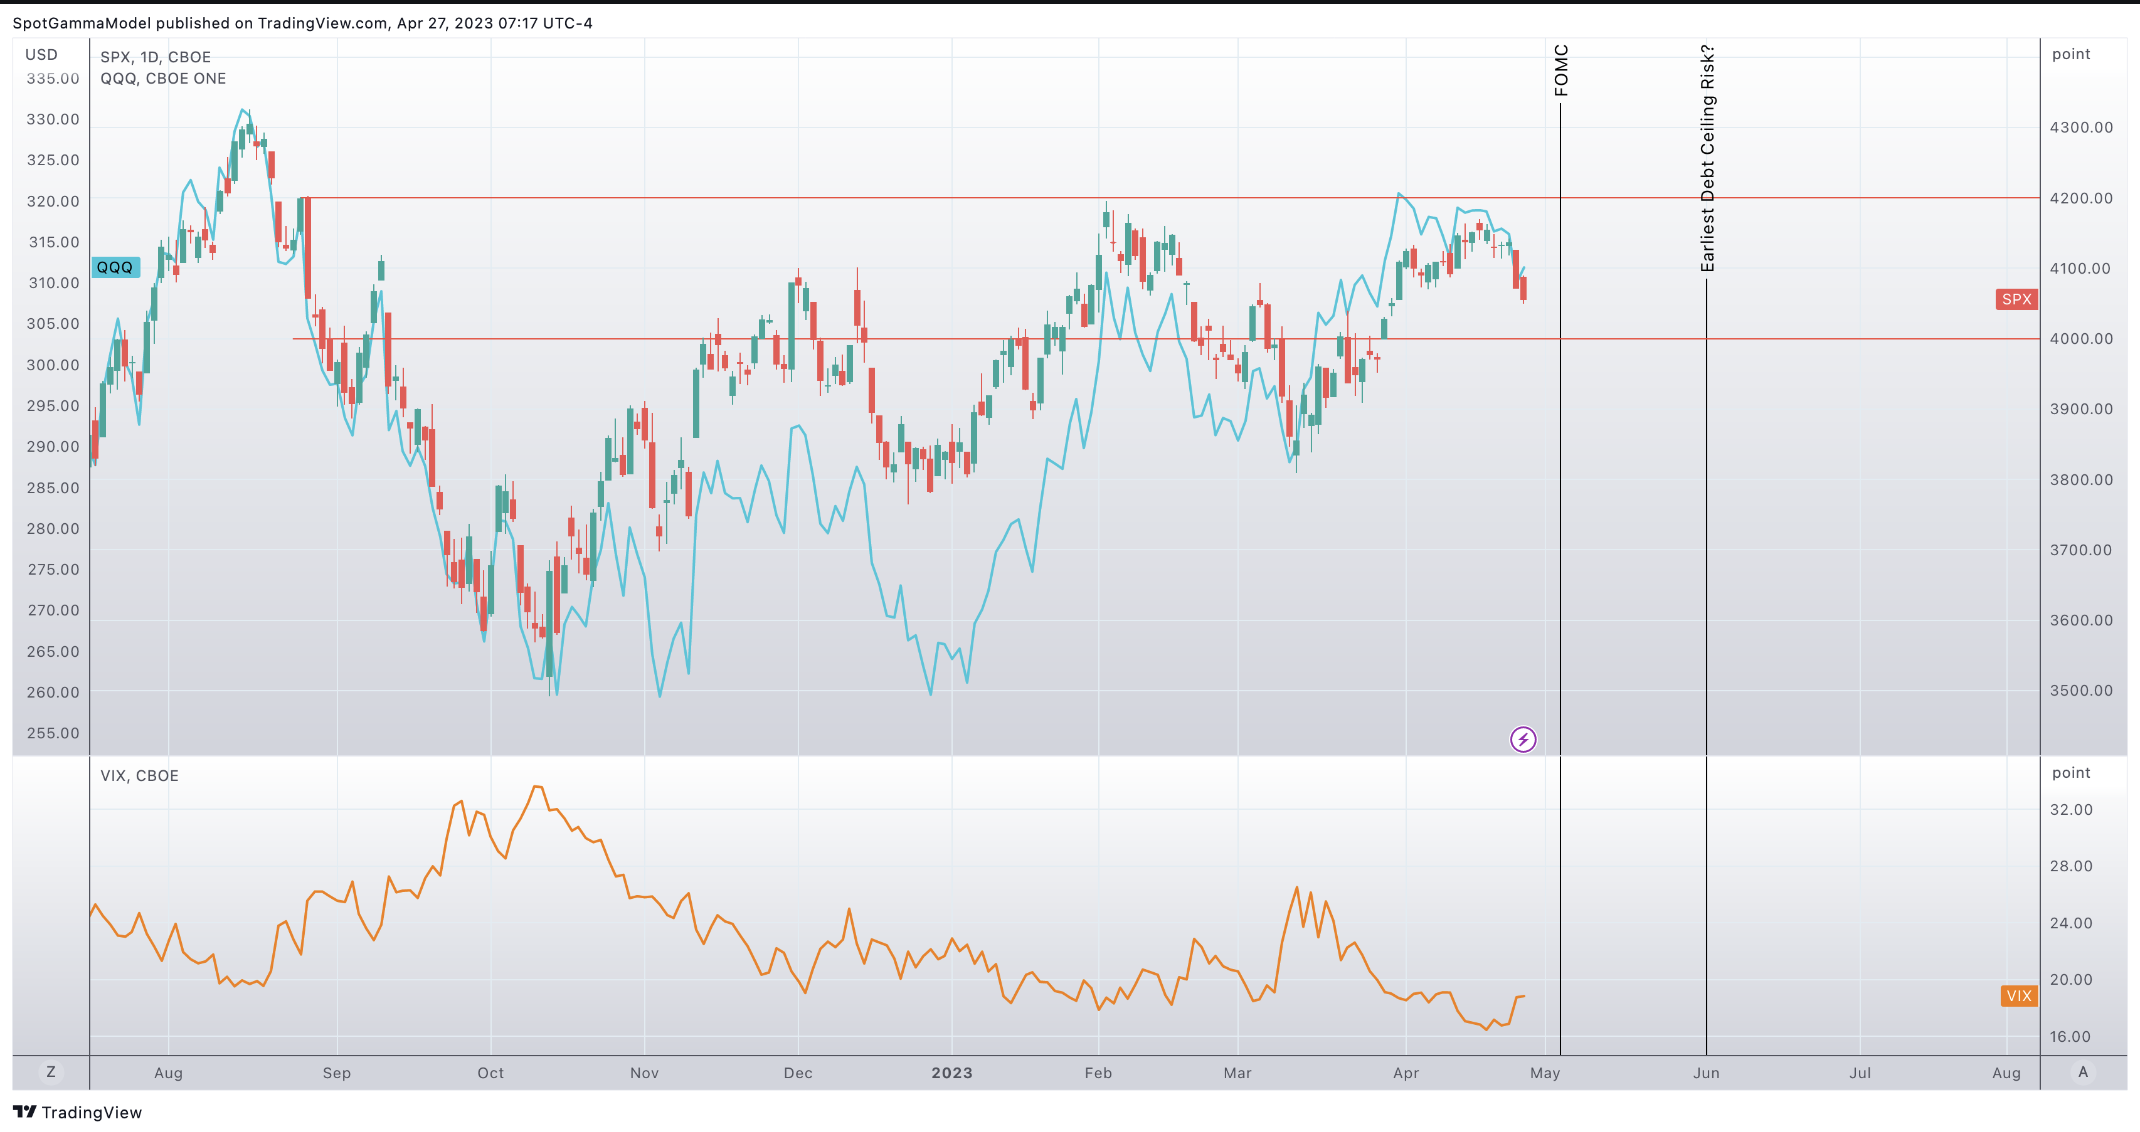
For sake of argument, we naively mark June as the earliest risk from debt ceiling issues (there are obviously a myriad of shifting factors here including politics and treasury balances). If the FOMC comes off as rather benign, traders may see May as a month of relative “risk-on”. Short-term focused 0DTE’ers + vol sellers could resurface to boost markets pushing us back to recent highs of 320 QQQ / 4200 SPX.
This view falls apart should the SPX break the massive gamma level of 4000, as below there hedging flows are tied to negative gamma positions which drive volatility higher (and markets lower).
| SpotGamma Proprietary Levels | SPX | SPY | NDX | QQQ | RUT | IWM |
|---|---|---|---|---|---|---|
| Reference Price: | $4055 | $404 | $12806 | $311 | $1730 | $171 |
| SpotGamma Implied 1-Day Move: | 0.89% | 0.89% |
|
|
|
|
| SpotGamma Implied 5-Day Move: | 2.32% |
|
|
|
|
|
| SpotGamma Volatility Trigger™: | $4090 | $408 | $12775 | $316 | $1770 | $176 |
| Absolute Gamma Strike: | $4000 | $405 | $12975 | $315 | $1800 | $170 |
| SpotGamma Call Wall: | $4200 | $412 | $12975 | $320 | $1780 | $178 |
| SpotGamma Put Wall: | $4000 | $400 | $11000 | $310 | $1600 | $170 |
| Additional Key Levels | SPX | SPY | NDX | QQQ | RUT | IWM |
|---|---|---|---|---|---|---|
| Zero Gamma Level: | $4093 | $409 | $12118 | $318 | $1904 | $184 |
| Gamma Tilt: | 0.82 | 0.6 | 1.5 | 0.69 | 0.57 | 0.36 |
| SpotGamma Gamma Index™: | -0.89 | -0.43 | 0.035 | -0.11 | -0.028 | -0.11 |
| Gamma Notional (MM): | $4.4B | $8.3B | $26M | $3.7B | $117M | $2.7B |
| 25 Day Risk Reversal: | -7.21% | -6.23% | -6.28% | -5.87% | -7.07% | -6.42% |
| Call Volume: | 553K | 2M | 8.8K | 686K | 14K | 242K |
| Put Volume: | 813K | 2.6M | 6.9K | 1.1M | 34K | 1.3M |
| Call Open Interest: | 5.9M | 7M | 52K | 4.5M | 169K | 3M |
| Put Open Interest: | 12M | 13M | 57K | 8.1M | 325K | 6.7M |
| Key Support & Resistance Strikes |
|---|
| SPX Levels: [4150, 4100, 4050, 4000] |
| SPY Levels: [410, 407, 405, 400] |
| NDX Levels: [14000, 13200, 13000, 12975] |
| QQQ Levels: [315, 312, 310, 300] |
| SPX Combos: [(4251,89.15), (4226,79.51), (4202,95.50), (4174,85.76), (4149,89.41), (4141,82.45), (4129,77.80), (4121,82.08), (4101,82.00), (4064,94.66), (4060,80.36), (4052,96.30), (4044,78.84), (4040,79.22), (4032,92.54), (4024,91.35), (4011,96.84), (3999,97.12), (3991,91.92), (3983,75.88), (3975,85.39), (3971,77.48), (3951,94.99), (3926,75.93), (3910,86.25), (3902,97.25), (3886,76.44), (3861,78.11)] |
| SPY Combos: [402.35, 397.09, 403.16, 405.18] |
| NDX Combos: [12973, 12730, 12320, 12653] |
| QQQ Combos: [311.87, 318.11, 301.89, 310] |
0 comentarios