Macro Theme:
Major Resistance: $4,150 – $4,160 (SPY $415)
Pivot Level: $4,100
Major Support: $4,000
Range High: $4,200 Call Wall
Range Low: $3,900 Put Wall
‣ IV lows coincide with the $4,200 Call Wall to create $4,150-$4,200 area resistance into May OPEX
‣ A break of 4100 is “risk off”, likely invoking a test of $4,000
‣ Equities may enter a “window of weakness” starting with 5/17 VIX & 5/19 OPEX
Founder’s Note:
Futures are up a few bps to 4150. Major levels remain unchanged: 4150 – 4160 (SPY 415) is resistance, with 4130 (SPY 412) & 4100 support. We anticipate today’s price action to mirror that of the last several sessions (i.e. tight trading ranges inside of large gamma strikes), but look for the chances of a range break (4100-4150) to increase after the Wednesday AM VIX expiration. We assign edge to a downside break of the range into next week, sparked by the expiration of fairly large call positions. As expressed in other notes, our “risk off” signal is a break of 4100.
Our core themes heading into this week have been the following:
4100 is “risk off”, but 4000 should offer some support if tested. <4000 is where options positions are “purely puts” which suggests convex downside/higher vol-of-vol. The passing of 5/17 VIX exp & 5/19 OPEX removes the options positions which may have been pinning the market. The 4200 Call Wall has failed to roll higher on several upside tests over the past 6 months. Our models mark the Call Wall as the top of our longer term “fair value” range. Realized volatility is a +1 year lows, as is IV. This means that volatility sellers are earning little premium as options are “priced for perfection” (particularly short dated). SPX puts & VIX calls are near/at record open interest levels, which could accelerate downside. June has very large options positions, which can reinforce directional price action, particularly >June 1.
We think this positioning on its own can cause some mean reversion after OPEX, but ultimately a catalyst is need to spark reflexive downside action. Over recent weeks we’ve all become accustom to small market dips/rises in IV being met with mean reversion. Our confidence in that mean reversion is now being reduced, particularly as this week progresses. Headlines could “matter more” with the reduction of volatility suppressing OPEX gamma.
Several people have responded to aspects of this options positioning, commenting that the record put positions/VIX calls imply traders are hedged which should limit downside. In response, we point to IV’s which are pricing in low volatility. How are 1 year RV/IV lows bearish, particularly with the S&P sniffing 9 months highs?
Looking at traders views of volatility, 1m/2m ATM IV is ~16% and that collapses down to 0DTE IV which is ~13.5%. Shown below is the 0DTE straddle priced as a % of the SPX, which has hit long term lows near 60bps (from GS via ZH).
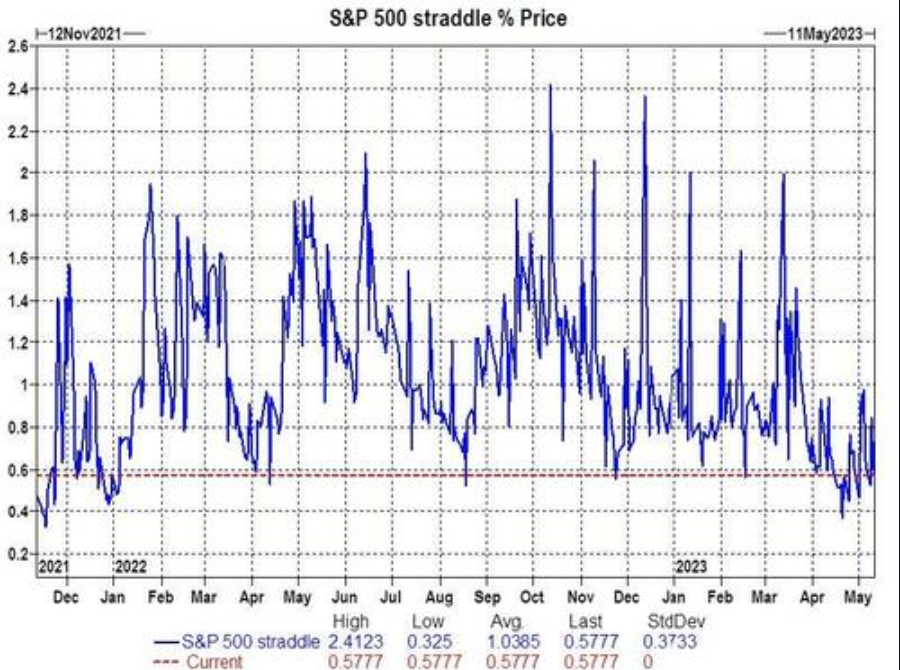
These lows are obviously an expression of expected volatility, and hearken back to this idea of “priced for perfection”. The risk premium you arguably receive from selling volatility at these levels decreases incrementally as you bet on lower levels of volatility. As you can see from chart above, anything more than a 60bps move in the S&P pushes the 0DTE options out of bounds and could invoke hedging flows that in turn create volatility. This, in our view, makes the current situation fragile.
If you turn to look at upside, the picture seems to be much clearer to read. If the S&P closes >4150 that implies 4200 should draw the market into OPEX, but we continue to see that as the maximum upside into Friday. This view of dampened S&P upside volatility is the prime reason we look to calls in mega cap and/or “AI” to express upside. Further, these index Call Walls have refused to roll higher despite several market tests of the 4150-4200 area over the last several months.
| SpotGamma Proprietary Levels | SPX | SPY | NDX | QQQ | RUT | IWM |
|---|---|---|---|---|---|---|
| Reference Price: | $4124 | $411 | $13340 | $325 | $1740 | $172 |
| SpotGamma Implied 1-Day Move: | 0.85% | 0.85% |
|
|
|
|
| SpotGamma Implied 5-Day Move: | 2.36% |
|
|
|
|
|
| SpotGamma Volatility Trigger™: | $4110 | $410 | $12890 | $323 | $1750 | $175 |
| Absolute Gamma Strike: | $4000 | $412 | $12975 | $320 | $1750 | $175 |
| SpotGamma Call Wall: | $4200 | $415 | $12975 | $330 | $1780 | $178 |
| SpotGamma Put Wall: | $4000 | $400 | $13175 | $315 | $1700 | $170 |
| Additional Key Levels | SPX | SPY | NDX | QQQ | RUT | IWM |
|---|---|---|---|---|---|---|
| Zero Gamma Level: | $4100 | $414 | $12528 | $322 | $1872 | $182 |
| Gamma Tilt: | 1 | 0.80 | 2 | 1.1 | 0.64 | 0.45 |
| SpotGamma Gamma Index™: | 0.20 | -0.21 | 0.08 | 0.02 | -0.03 | -0.11 |
| Gamma Notional (MM): | $5.1B | $9.3B | $34M | $4B | $162M | $3.4B |
| 25 Day Risk Reversal: | -0.07 | -0.08 | -0.07 | -0.06 | -0.07 | -0.08 |
| Call Volume: | 522K | 2.1M | 7.9K | 641K | 33K | 216K |
| Put Volume: | 968K | 2.8M | 8.2K | 962K | 51K | 477K |
| Call Open Interest: | 6.2M | 7.1M | 58K | 4.6M | 200K | 3.4M |
| Put Open Interest: | 13M | 14M | 66K | 8.7M | 361K | 7.5M |
| Key Support & Resistance Strikes |
|---|
| SPX Levels: [4200, 4150, 4100, 4000] |
| SPY Levels: [415, 412, 410, 400] |
| NDX Levels: [13300, 13200, 13000, 12975] |
| QQQ Levels: [325, 322, 320, 315] |
| SPX Combos: [(4326,79.65), (4322,87.63), (4301,97.51), (4277,86.79), (4260,78.13), (4252,94.75), (4223,90.56), (4219,83.14), (4211,78.79), (4207,89.24), (4198,98.84), (4190,92.58), (4182,86.75), (4174,93.27), (4169,84.92), (4161,75.92), (4157,77.14), (4153,80.64), (4149,96.48), (4136,76.17), (4128,79.64), (4120,86.30), (4091,77.48), (4087,89.00), (4079,82.51), (4075,83.49), (4066,76.03), (4058,90.25), (4050,95.65), (4029,83.64), (4025,80.45), (4009,90.72), (4000,98.01), (3976,80.57), (3959,79.34), (3951,91.38), (3926,81.07)] |
| SPY Combos: [418.61, 398.44, 428.49, 413.67] |
| NDX Combos: [12980, 13540, 13340, 13754] |
| QQQ Combos: [328.77, 314.8, 326.82, 333.65] |
0 comentarios