Macro Theme:
Major Resistance: $4,230 (SPY $422 Call Wall)
Pivot Level: $4,200
Interim Support: $4,175
Range High: $4,300 Call Wall
Range Low: $4,000 Put Wall
‣ We are bullish on the S&P with a close >$4,200
‣ S&P500 may close its performance gap to Nasdaq based on IV and call positions
‣ June FOMC 6/14
Founder’s Note:
S&P futures are fractionally higher to 4,200, with NQ flat at 14311. Key notable changes in last nights levels were the SPY and QQQ Call Walls, which contracted to 422 & 350, respectively. This creates overhead resistance for the S&P at 4,230 (SPY 422), then 4,250. Support is at the 4,175 (Vol Trigger). 4,200 continues to be the critical pivot level, as we hold a bullish stance above and are neutral below.
In QQQ resistance is at the 350 Call Wall, and we would mark the Q’s as overbought should that level be breached. QQQ support is at 346 (Vol Trigger).
The Debt Ceiling issue has moved forward, which is a market positive. For the S&P, this seems like a setup for “positive drift” as there are supportive positions below, and upside rooms to the Call Wall(s).
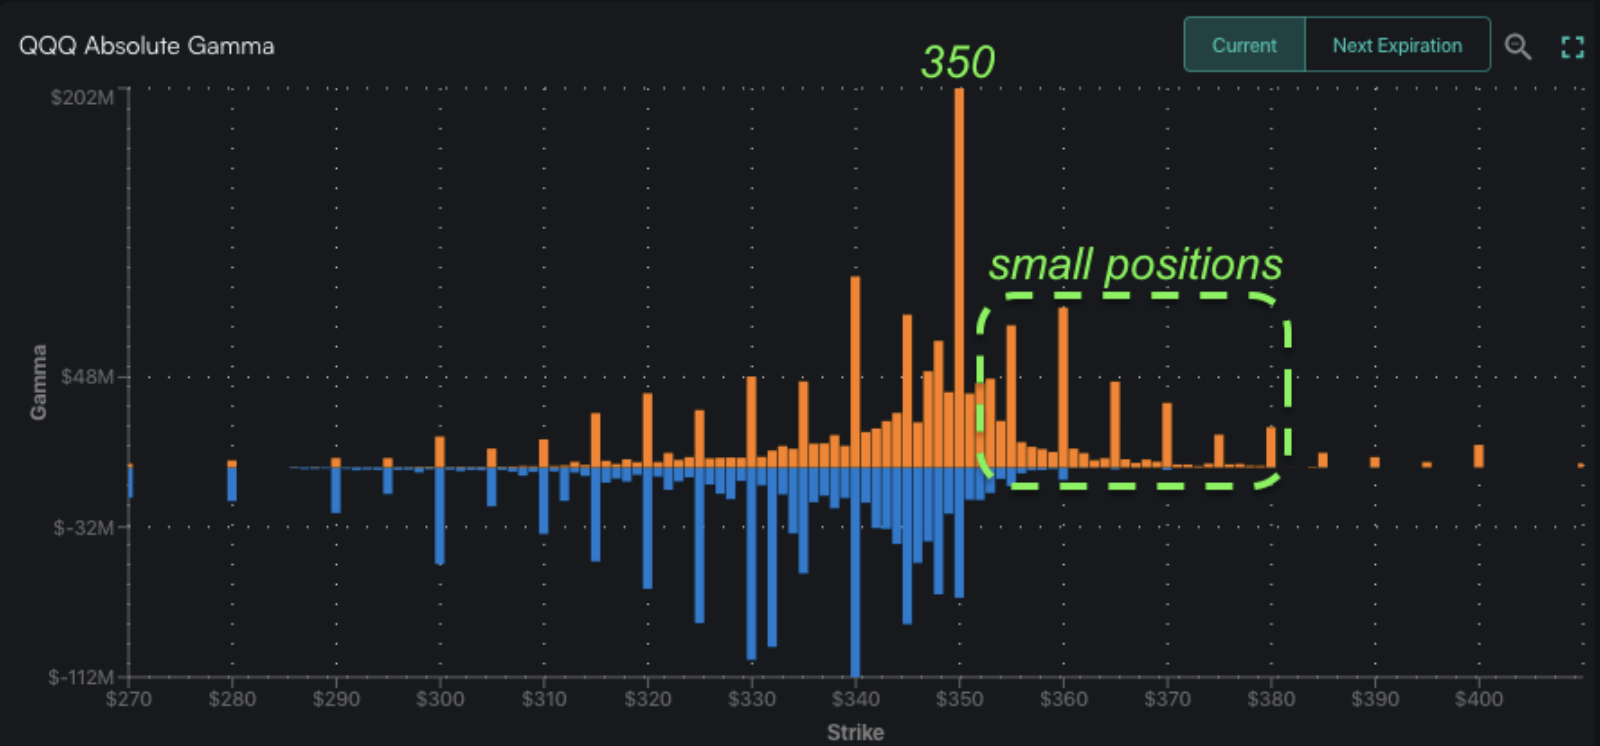
We also note C3 earnings (ticker AI), which have the stock down 21% premarket. This may lead to some further relative consolidation in tech, particularly given the elevated IV’s. Further, as you can see below, there are small positions >350 which suggest traders are not adding calls (orange) to strikes above. Calls added above serve to push the Call Wall higher, which we generally read as a bullish indication.
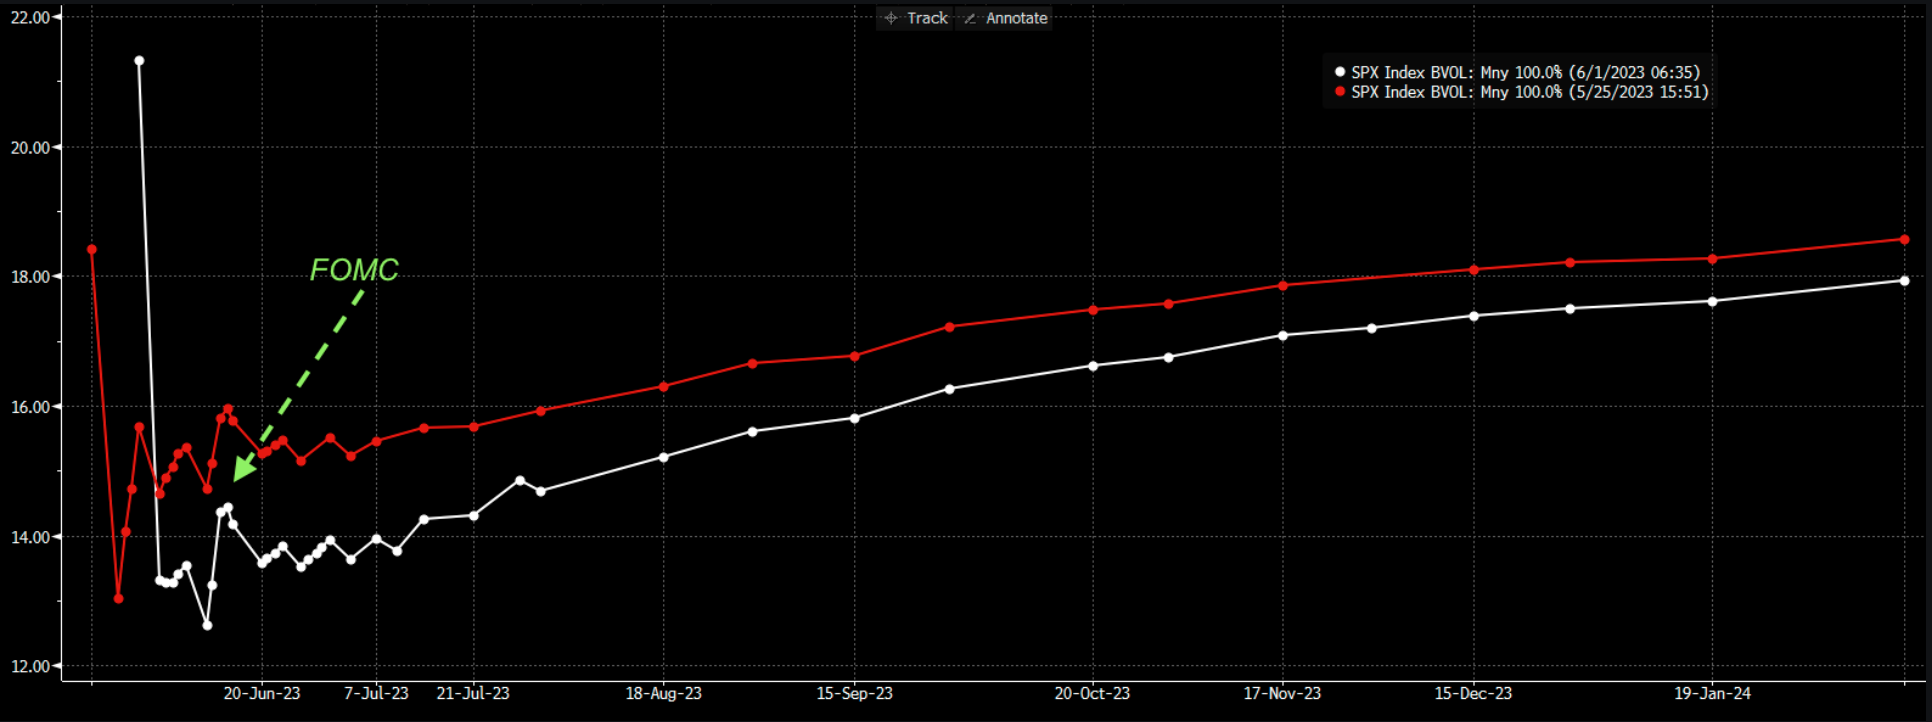
Back to S&P, with that Debt Ceiling drama apparently ending, traders attention likely turns to June 14th FOMC. The market is responding to this in kind, with IV’s pressing materially lower. 1 month realized S&P vol is down at 14%, and so the implied spread to realized is once again gone. You can see this reflected in pre-FOMC IV’s, which are all <=14%.
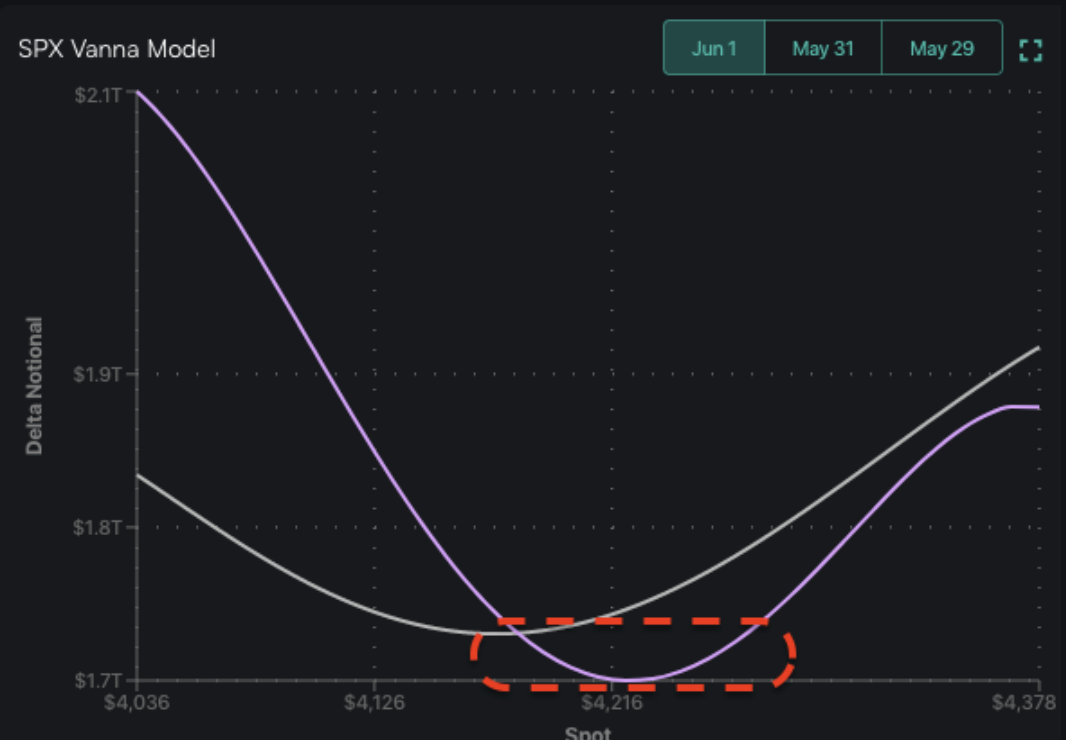
Given this (or despite the small spread), our vanna model shows that a reduction in IV may still help to provide a bit of a lift for equities. This is seen through the IV-adjusted delta notional (purple) being under that of standard delta’s (grey). We’d anticipate this vanna tailwind to die off should the S&P push into 4,230 (SPY Call Wall).
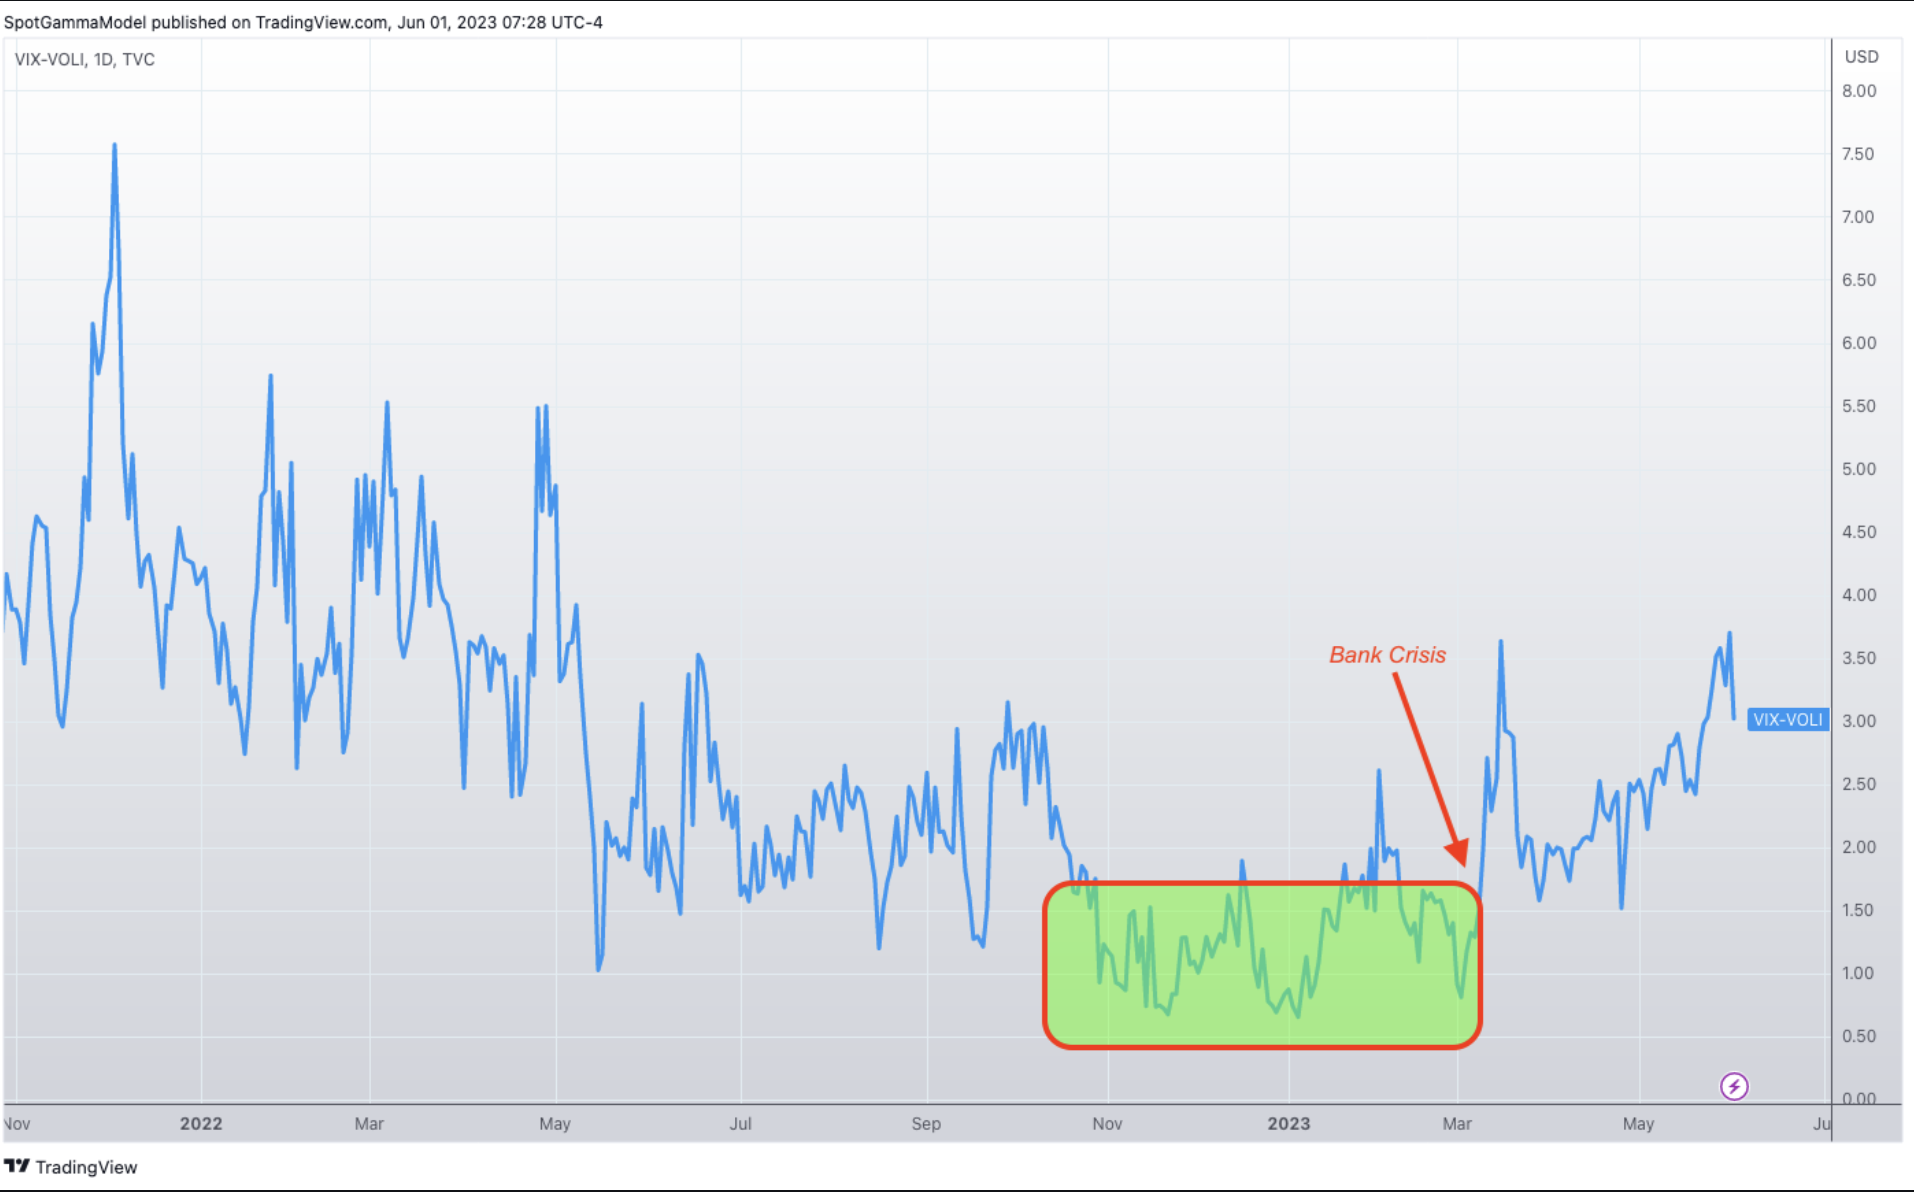
Even though those ATM IV’s are tight to RV (or even below), downside skew may still have to come down which is likely what the vanna model is picking up. The elevated skew is suggested through the VIX – VOLI indicator, as the VIX incorporates OTM options prices whereas VOLI simply measures ATM SPY IV. As you can see this metric was materially lower from late ’22 and into the March bank crisis (back when tail risk was particularly out of style).
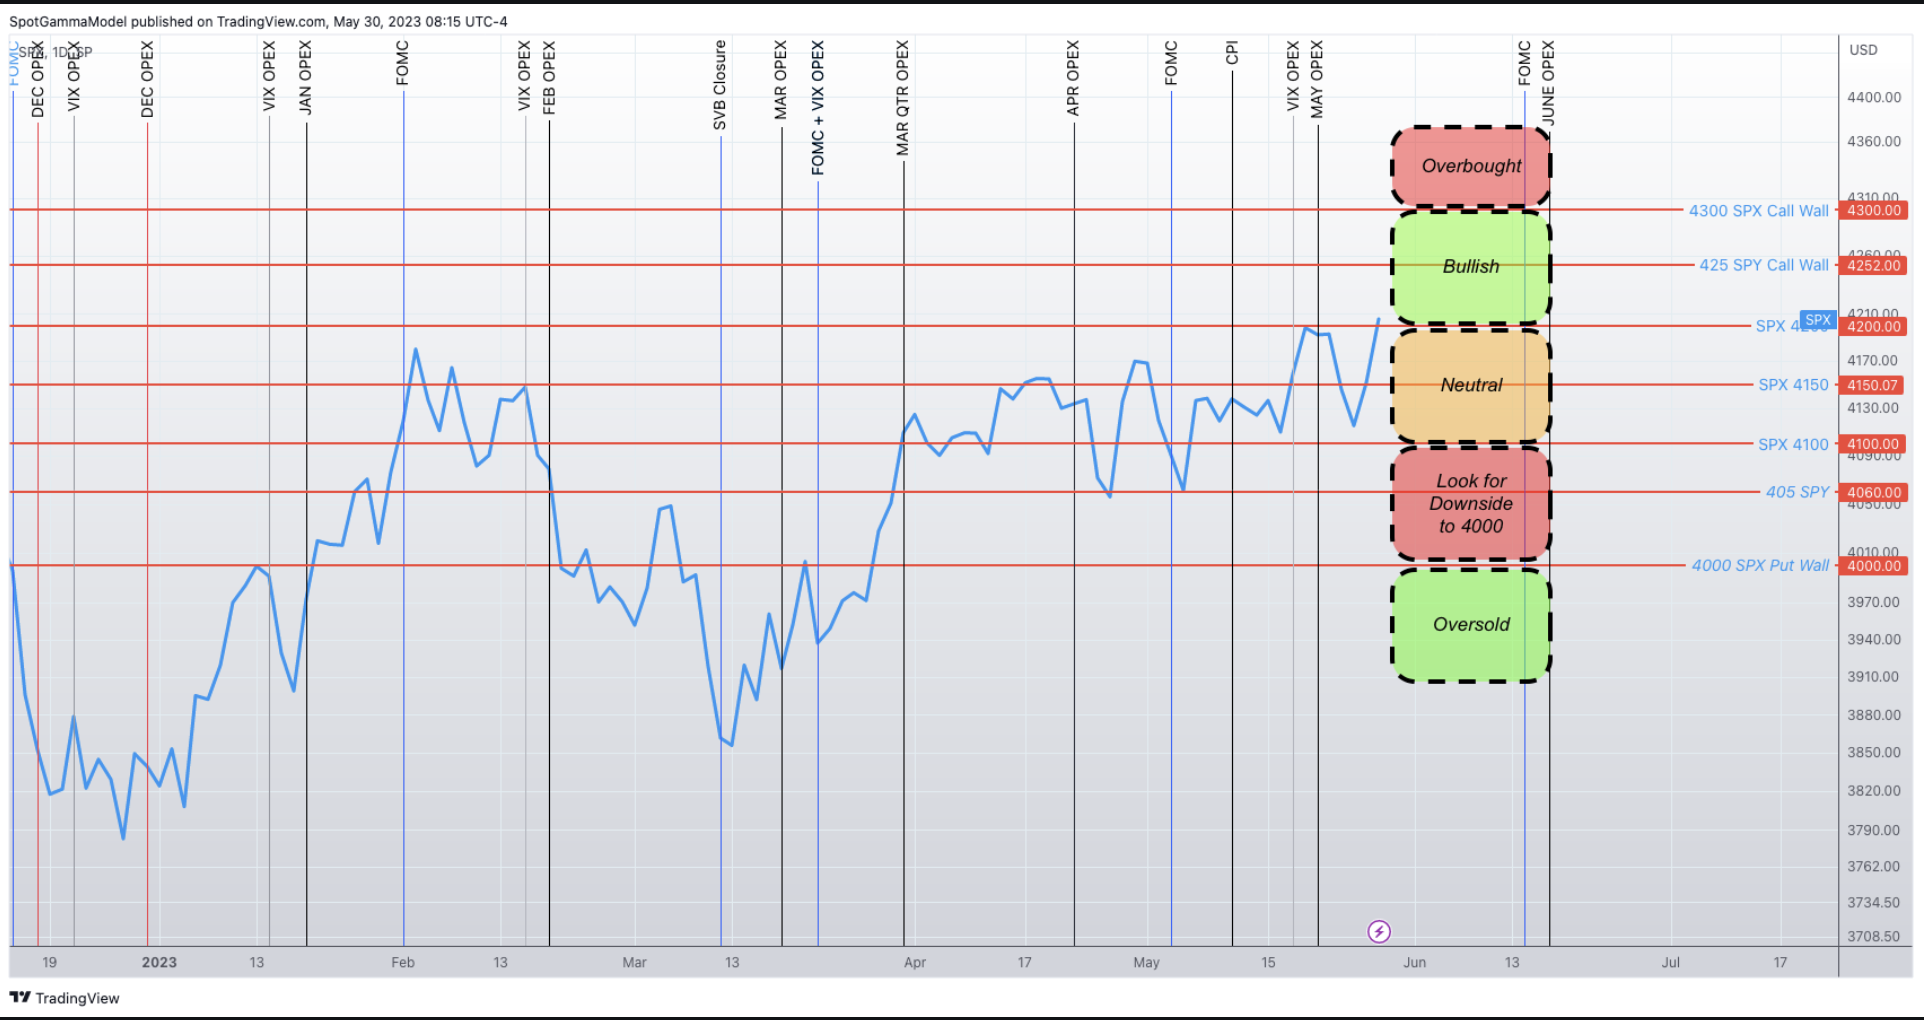
Below is our map from 5/30, which still holds. We shift to “risk on” only if the S&P can regain 4,200. There are several support lines below, namely 4,150 & 4,100. These support bars, in our view, suggest any downside would be more of a “grind” rather than “flush”. For this reason we favor playing mean reversion off of these large gamma strikes (buying dips and selling rips), whereas over 4,200 we’d favor a long directional bias.
| SpotGamma Proprietary Levels | SPX | SPY | NDX | QQQ | RUT | IWM |
|---|---|---|---|---|---|---|
| Reference Price: | $4179 | $417 | $14254 | $347 | $1749 | $173 |
| SpotGamma Implied 1-Day Move: | 0.85% | 0.85% |
|
|
|
|
| SpotGamma Implied 5-Day Move: | 2.34% |
|
|
|
|
|
| SpotGamma Volatility Trigger™: | $4170 | $419 | $13175 | $346 | $1770 | $175 |
| Absolute Gamma Strike: | $4150 | $420 | $13850 | $350 | $1800 | $175 |
| SpotGamma Call Wall: | $4300 | $422 | $13850 | $350 | $1790 | $180 |
| SpotGamma Put Wall: | $4000 | $415 | $11000 | $332 | $1700 | $170 |
| Additional Key Levels | SPX | SPY | NDX | QQQ | RUT | IWM |
|---|---|---|---|---|---|---|
| Zero Gamma Level: | $4155 | $420 | $0 | $347 | $1854 | $181 |
| Gamma Tilt: | 1.131 | 0.779 | 2.709 | 0.977 | 0.695 | 0.501 |
| SpotGamma Gamma Index™: | 0.671 | -0.237 | 0.101 | -0.007 | -0.026 | -0.097 |
| Gamma Notional (MM): | $145.326M | ‑$846.094M | $13.415M | ‑$91.708M | ‑$27.867M | ‑$1.017B |
| 25 Day Risk Reversal: | -0.062 | -0.061 | -0.032 | -0.044 | -0.057 | -0.058 |
| Call Volume: | 448.29K | 1.886M | 8.917K | 666.865K | 17.326K | 358.891K |
| Put Volume: | 890.338K | 2.491M | 7.485K | 1.17M | 26.347K | 641.715K |
| Call Open Interest: | 6.331M | 7.008M | 72.493K | 4.687M | 207.602K | 3.481M |
| Put Open Interest: | 12.266M | 13.812M | 63.273K | 9.843M | 361.765K | 7.493M |
| Key Support & Resistance Strikes |
|---|
| SPX Levels: [4200, 4150, 4100, 4000] |
| SPY Levels: [420, 418, 415, 410] |
| NDX Levels: [15125, 15100, 14000, 13850] |
| QQQ Levels: [350, 345, 340, 330] |
| SPX Combos: [(4351,94.59), (4326,91.55), (4322,92.90), (4305,78.02), (4301,99.33), (4289,81.56), (4280,82.75), (4276,95.30), (4272,76.67), (4259,85.68), (4255,89.29), (4251,98.59), (4247,81.40), (4238,89.72), (4230,84.56), (4226,98.22), (4222,84.84), (4209,90.32), (4205,84.59), (4201,97.77), (4155,89.68), (4151,74.56), (4138,84.59), (4125,89.47), (4105,74.12), (4100,91.34), (4054,81.22), (4050,91.83), (4025,81.50), (4004,84.89), (4000,96.97)] |
| SPY Combos: [422.43, 427.02, 417.41, 437.05] |
| NDX Combos: [13855, 14340, 14753, 13598] |
| QQQ Combos: [335.95, 358.23, 348.14, 353.01] |
0 comentarios