Macro Theme:
Major Resistance: $4,350 (SPY $435 Call Wall)
Pivot Level: $4,300
Interim Support: $4,250
Range High: $4,400 Call Wall
Range Low: $4,000 Put Wall
‣ We are neutral on the S&P, and looking for a window of weakness post 6/14 FOMC & 6/16 OPEX
Founder’s Note:
Futures are flat to 4,350 (Sep ES Contract). 4,300 SPX remains the major level on the board, with resistance above there at 4,320. Support shows at 428 SPY (4,280 SPX).
The SPX Call Wall has rolled to 4,400, with SPY Call Wall at 435 which implies that a move >4,300 is no longer overbought. However, we still anticipate volatility remaining low for todays session, and look for the S&P to mean revert off of large gamma strikes.
In QQQ we see 350 as major support, with resistance at 355 & 360. A move over the 360 QQQ Call Wall is considered overbought.
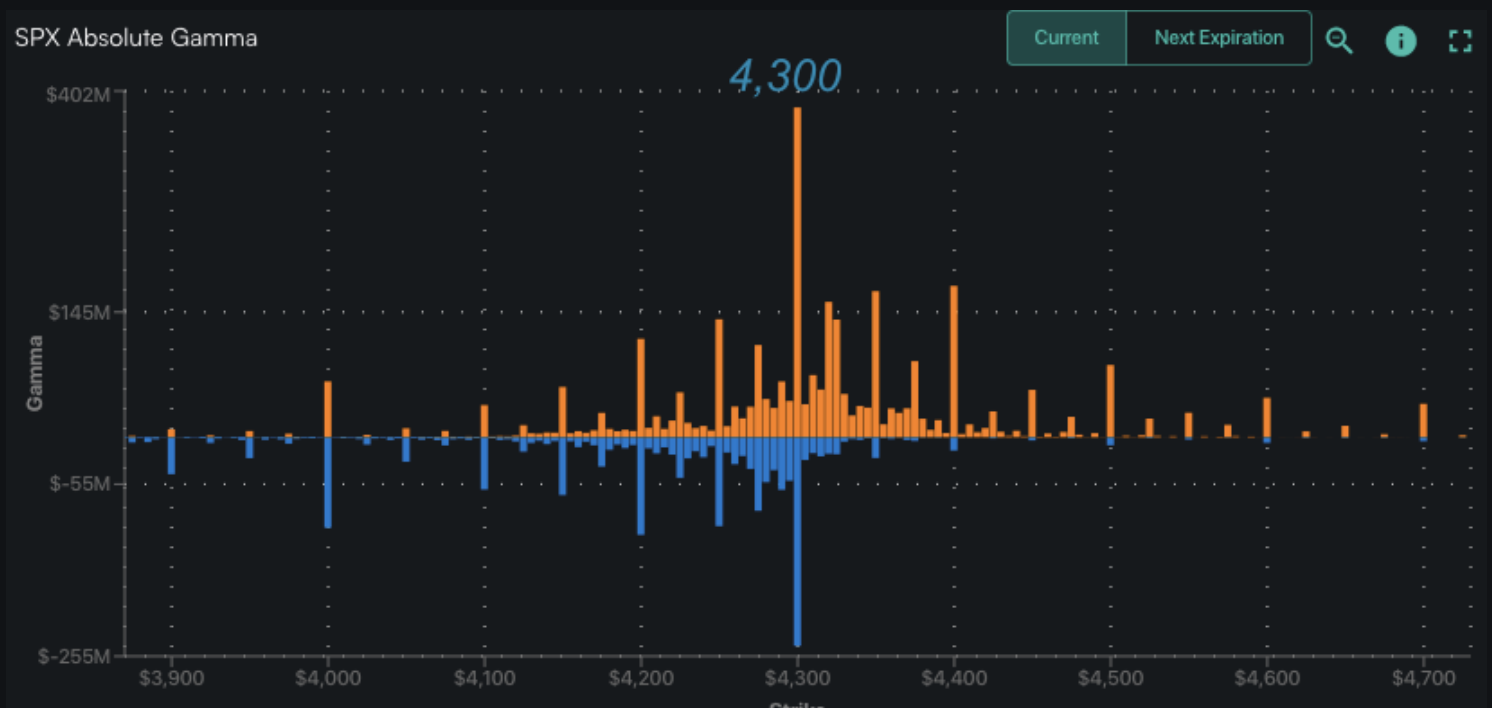
As shown below, 4,300 is a “beast”. With this we anticipate the S&P rotating around this level (aka low volatility) into Wednesday’s FOMC. As futures have drifted over this level we’d look for it as support for today.
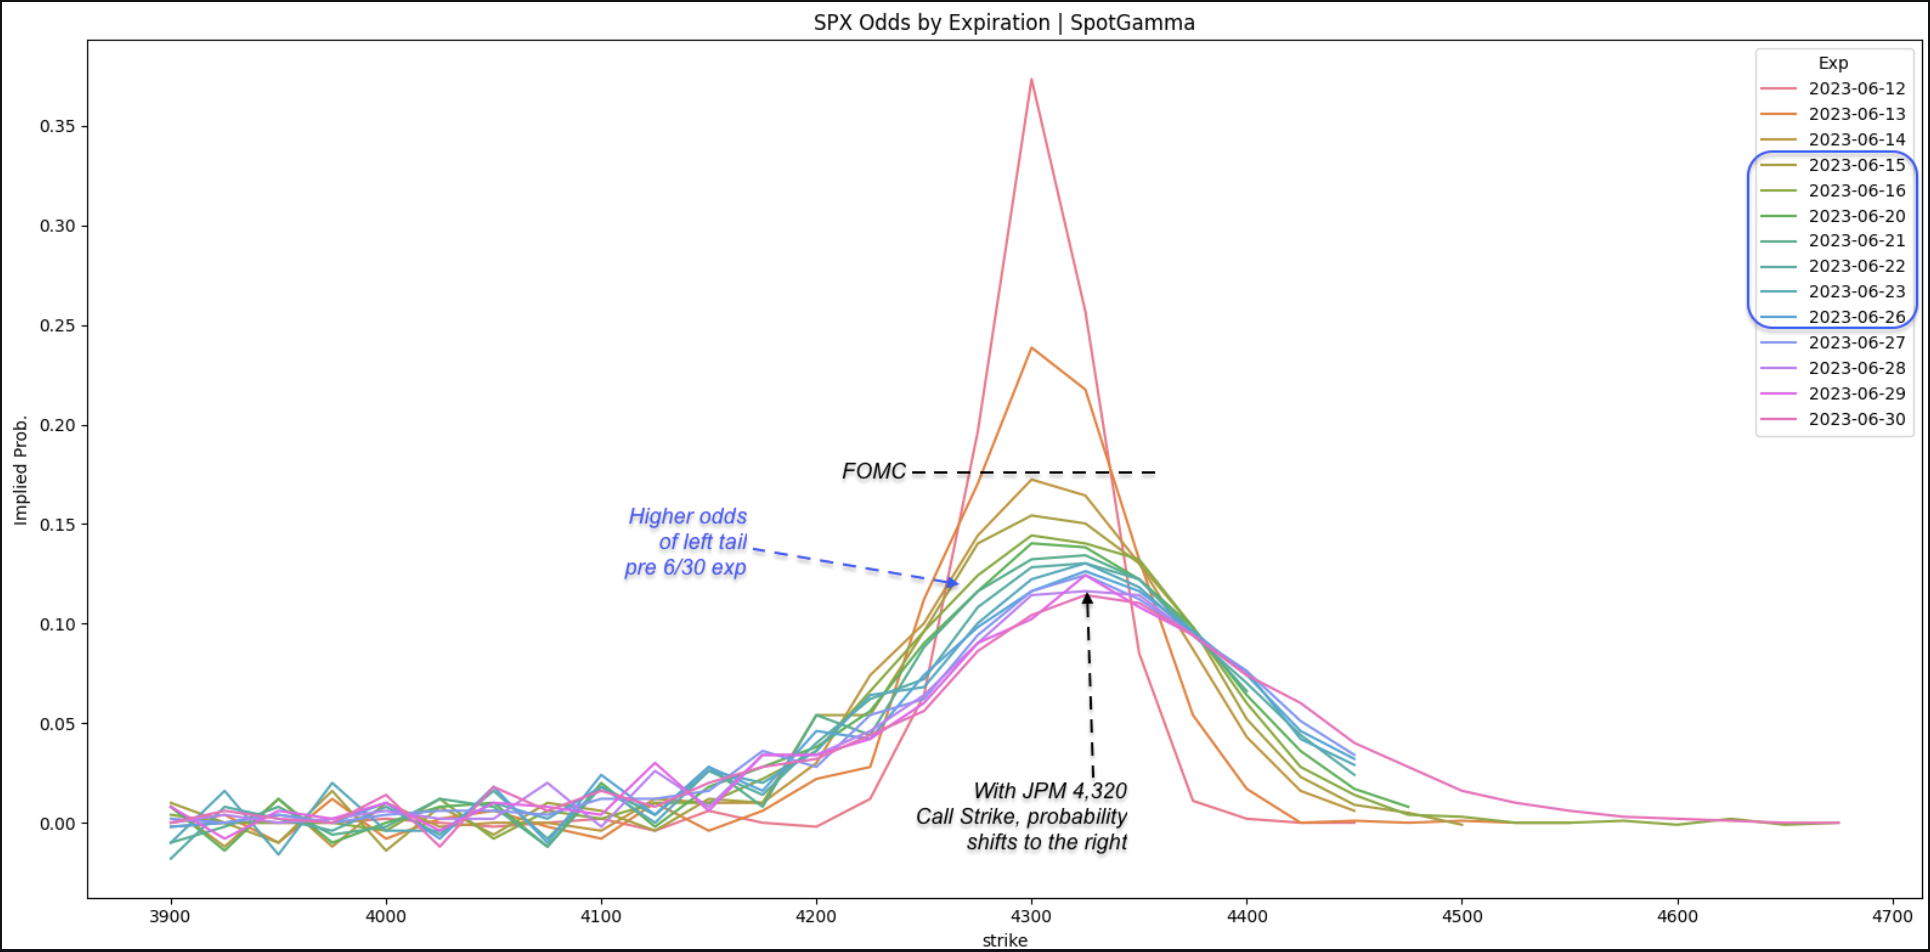
The best view of what the market is pricing is through the implied probability plot, shown below. This chart uses SPX options to calibrate the odds of the SPX closing at a given price, by a given expiration date.
As you can see the traders largely anticipates this ~4,300 pin before FOMC. There is then a big gap down, or flattening of the probability post-FOMC, as traders look for a winder range of SPX prices. In general it seems there are very low odds being priced of an SPX break of ~4,250 – 4,400 before July 1. What’s really interesting, though, is that the market prices a higher probability of lower SPX prices from FOMC out into the final week of June, as highlighted by expirations in the purple box. Then, the distribution shifts higher into month end, which is when the JPM collar rolls.
What’s ultimately being here reflected in this calculation is a shift, or distortion of options prices due to the large open interest at the 6/30 JPM call collar position (4,320). It leaves a footprint. However, one can’t help but to almost view this as if the market is pricing in a path…first lower, and then up into the JPM collar strike of 4,320 into June 30th expiration.
The ATM SPX for Friday expiration has an IV of 15.3% (ref: 4,315), which implies traders are pricing in daily moves of ~1%. While we have no opinion on what Powell will say, nor how the market will react – but this feels like pretty tight pricing. Additionally, we anticipate a window of market weakness driven by the call-heavy June OPEX, and one could argue the market is somewhat pricing this in based on the data above.
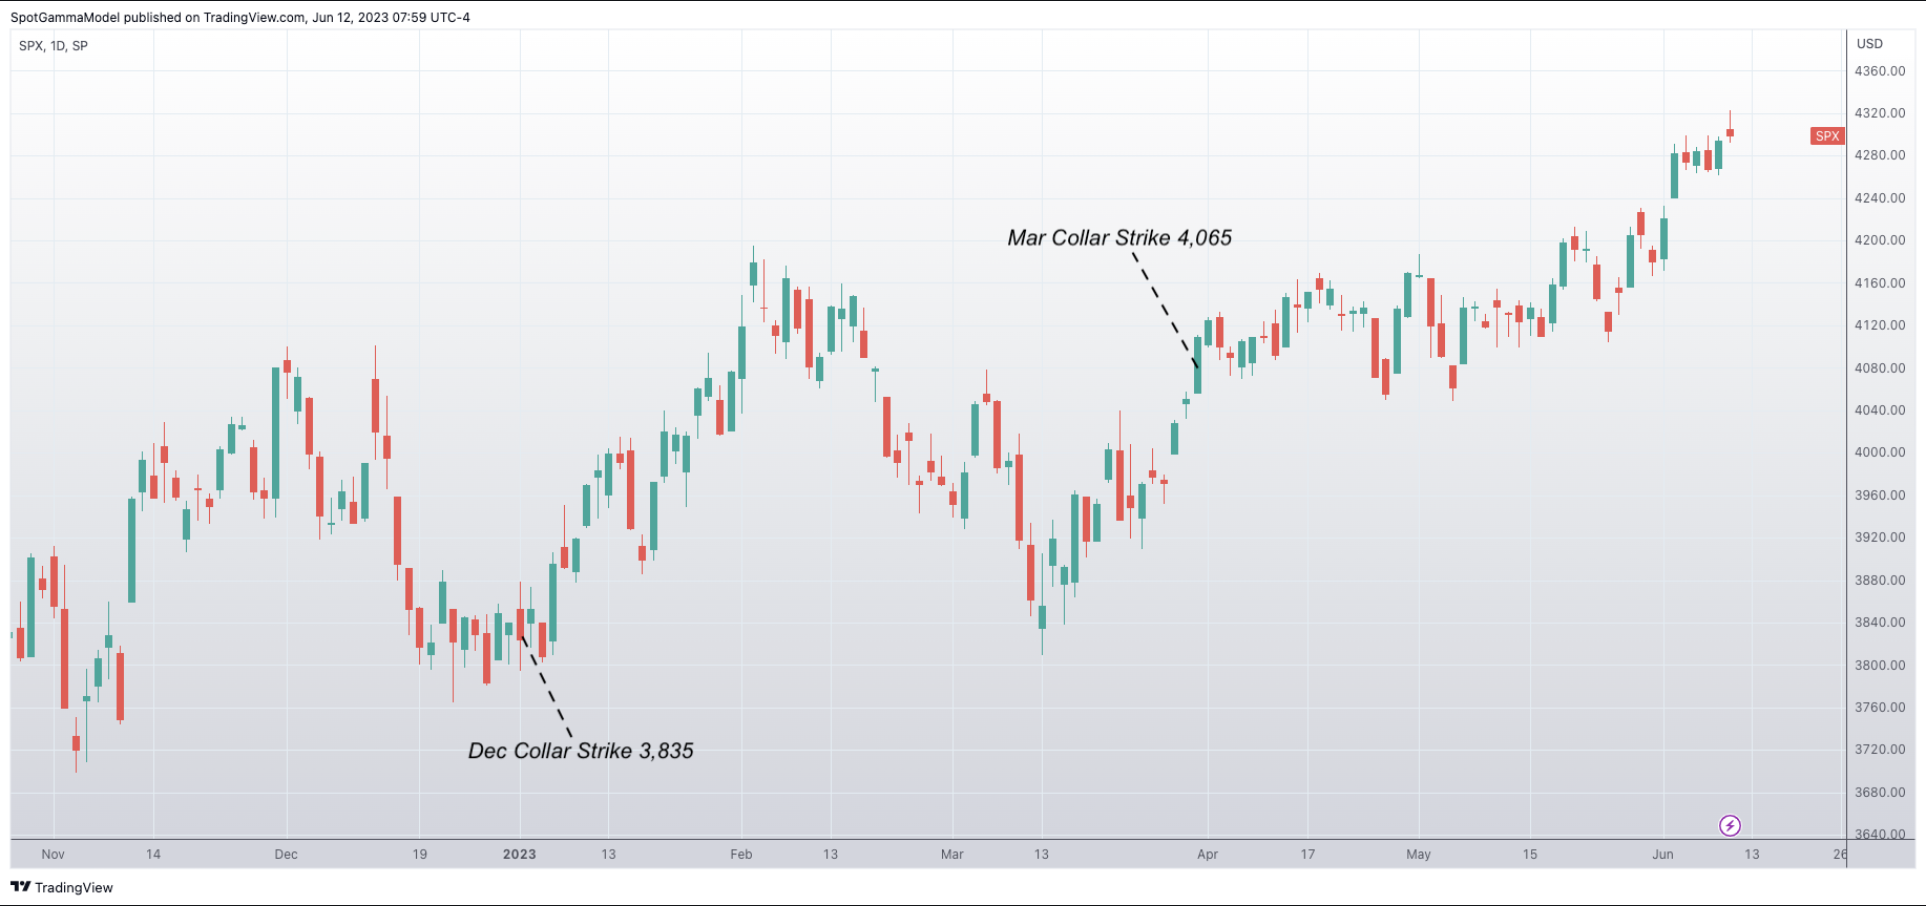
Second, we’ve seen some evidence of the market pinning or moving toward the JPM collar call strike. Consider January ’23 wherein the call strike was at 3,835 and the SPX closed at 3,839. In March the call strike was 4,060 and the SPX closed at 4,100 – but the SPX was 3,970 just 2 sessions before. The point is that the options market seems to be pricing higher prices by 6/30, too.
Our first order view is that volatility is set to expand due to the large June OPEX, catalyzed by the FOMC. Of course the market direction rests with traders reaction to Powell, but this idea of consolidation due to OPEX and then rally into the end of June is the path we’d favor – and it appears that is what the market is pricing, too.
| SpotGamma Proprietary Levels | SPX | SPY | NDX | QQQ | RUT | IWM |
|---|---|---|---|---|---|---|
| Reference Price: | $4298 | $429 | $14528 | $354 | $1865 | $185 |
| SpotGamma Implied 1-Day Move: | 0.80% | 0.82% |
|
|
|
|
| SpotGamma Implied 5-Day Move: | 2.18% |
|
|
|
|
|
| SpotGamma Volatility Trigger™: | $4245 | $429 | $12425 | $354 | $1770 | $181 |
| Absolute Gamma Strike: | $4300 | $430 | $13850 | $350 | $1800 | $185 |
| SpotGamma Call Wall: | $4400 | $435 | $13850 | $360 | $1790 | $190 |
| SpotGamma Put Wall: | $4000 | $415 | $12000 | $332 | $1750 | $170 |
| Additional Key Levels | SPX | SPY | NDX | QQQ | RUT | IWM |
|---|---|---|---|---|---|---|
| Zero Gamma Level: | $4210 | $426 | $0 | $354 | $1847 | $183 |
| Gamma Tilt: | 1.579 | 1.165 | 2.302 | 1.022 | 1.055 | 1.105 |
| SpotGamma Gamma Index™: | 2.595 | 0.154 | 0.098 | 0.007 | 0.004 | 0.015 |
| Gamma Notional (MM): | $1.074B | $571.093M | $12.889M | $19.117M | $4.375M | $105.503M |
| 25 Day Risk Reversal: | -0.032 | -0.051 | -0.024 | -0.038 | -0.028 | -0.028 |
| Call Volume: | 632.349K | 2.035M | 13.188K | 718.447K | 17.435K | 350.291K |
| Put Volume: | 1.084M | 2.778M | 9.547K | 1.116M | 28.186K | 431.179K |
| Call Open Interest: | 6.613M | 7.312M | 73.315K | 5.053M | 228.697K | 4.017M |
| Put Open Interest: | 13.188M | 14.336M | 74.665K | 10.424M | 393.476K | 8.15M |
| Key Support & Resistance Strikes |
|---|
| SPX Levels: [4350, 4300, 4250, 4200] |
| SPY Levels: [435, 430, 428, 425] |
| NDX Levels: [15125, 15100, 15000, 13850] |
| QQQ Levels: [360, 355, 350, 340] |
| SPX Combos: [(4501,98.29), (4475,84.25), (4449,96.32), (4424,88.78), (4419,74.76), (4411,76.08), (4402,99.86), (4389,82.91), (4381,88.05), (4376,98.32), (4372,91.29), (4363,88.05), (4359,93.55), (4350,99.87), (4346,90.53), (4342,94.80), (4333,85.04), (4329,95.68), (4325,99.34), (4320,99.76), (4316,90.53), (4312,96.04), (4299,99.75), (4273,83.58), (4252,88.31), (4148,81.02), (4101,89.42)] |
| SPY Combos: [430.33, 440.65, 432.48, 432.91] |
| NDX Combos: [14761, 14543, 13846, 15124] |
| QQQ Combos: [355.94, 360.9, 369.75, 338.59] |
0 comentarios