Macro Theme:
Major Resistance: $4,400 Call Wall
Pivot Level: $4,300
Interim Support: $4,300
Range High: $4,400 Call Wall
Range Low: $4,000 Put Wall
‣ We are neutral on the S&P, and looking for a window of weakness post 6/14 FOMC & 6/16 OPEX
Founder’s Note:
Futures are down 40bps to 4,400. Major upside resistance remains at the 440SPY/4,400SPX Call Wall(s). A move over 4,400 is considered to push the S&P into overbought territory. Support below shows at 4,350, followed by 433 SPY (4,330 SPX) & 4,300.
QQQ has resistance at 370, with support at 365 & 360.
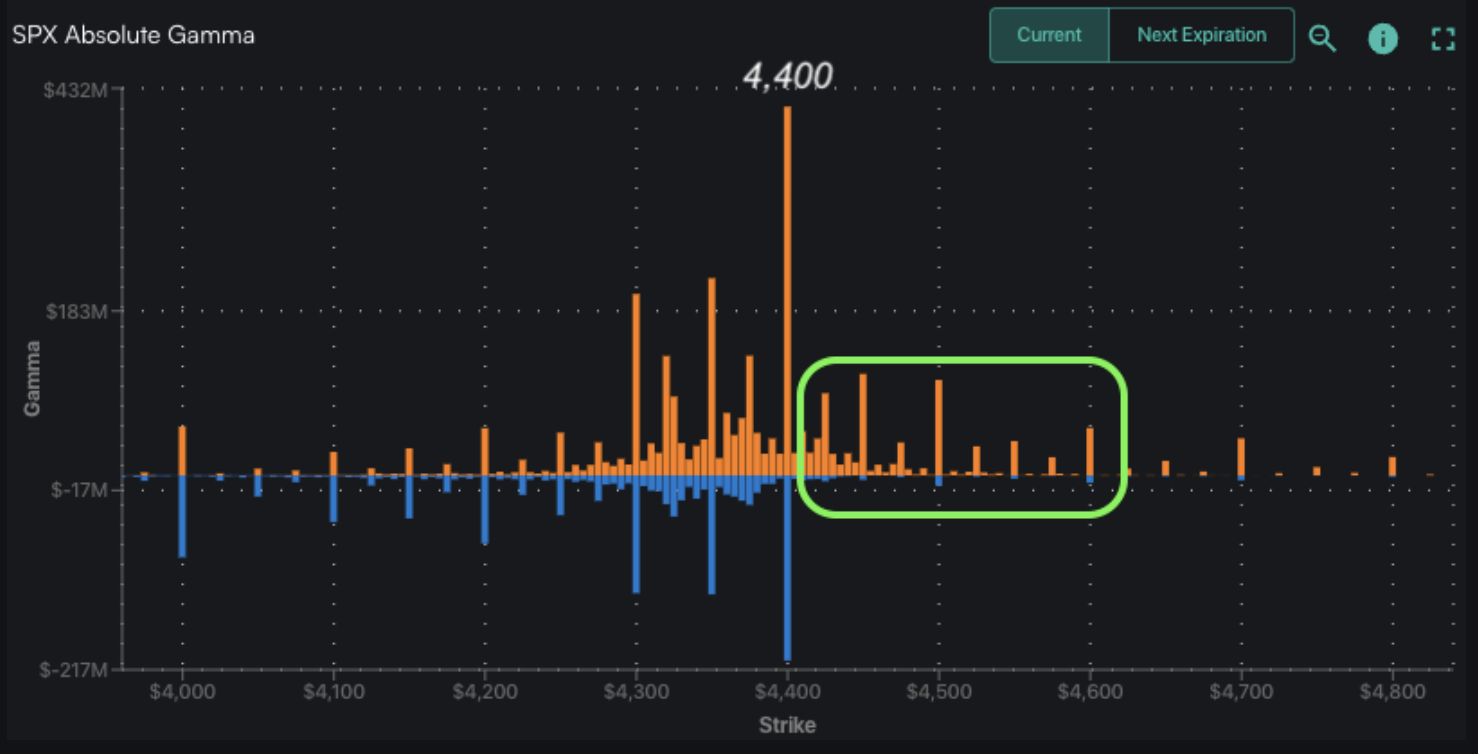
As shown below there is very little in the way of positioning >4,400, which implies the S&P is capped at 4,400 into tomorrow’s close. That being said, we remain of the opinion that the market has now entered a window of weakness in through next week, with eyes initially on the 4,300 level. For a more detailed breakdown on this view please see yesterday’s AM note.
Here we wanted to highlight a major factor in why we think markets are due for a pause: implied volatility. Specifically, call/upside strike IV’s. In this case we are focused on TSLA, but you can see this behavior across many names (AI stocks, IWM, etc).
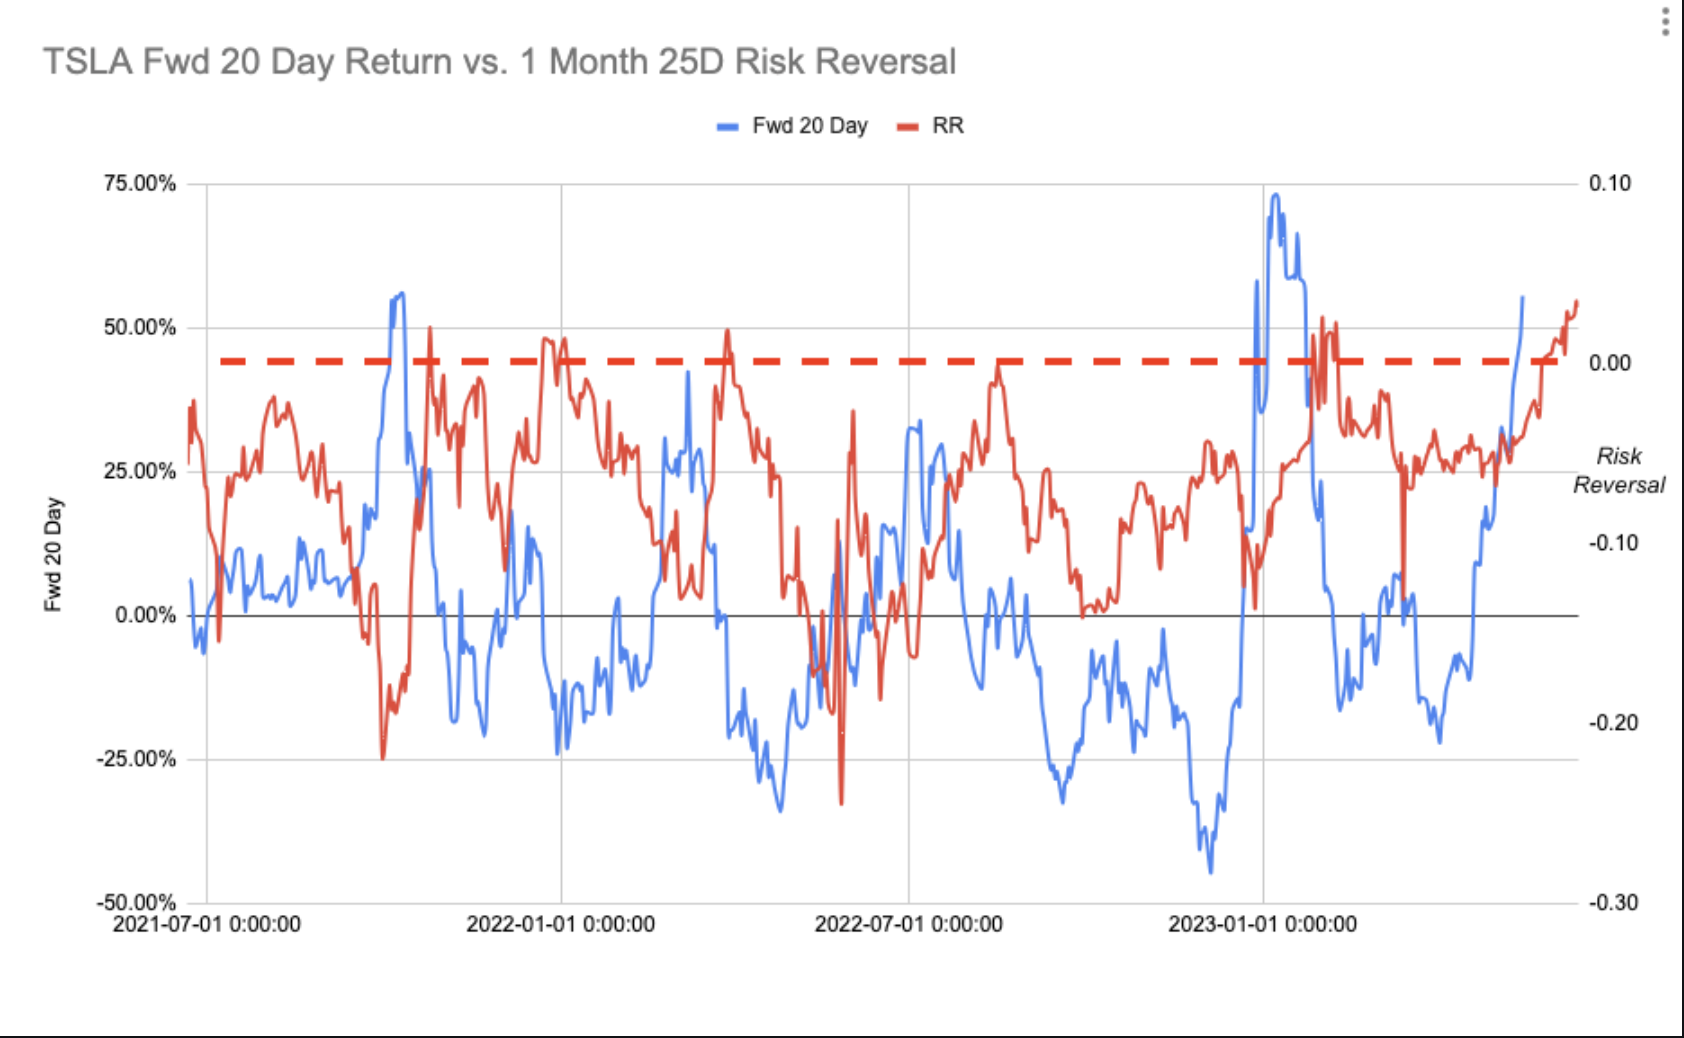
Shown below is our Risk Reversal (RR) measurement for TSLA, in red (right Y axis). This measures the value of a 1 month 25 delta call – 1 month 25 delta put.
This is plotted against the forward 20 day return of TSLA stock (blue). While this chart is admittedly busy, what you can see is that when the RR > 0, the forward return of TSLA is often dismal (i.e. blue line <0%). While this data only goes back to July ’21, are are currently seeing the longest number of days with this RR measure >0. Uncoincidentally, this is the longest period of positive days for TSLA stock ever (14 days, broken yesterday). If you are looking to play a reversal in TSLA, be aware that this is a situation in which TSLA IV may decrease as the stock drops which may favor put spreads or flys vs outright puts.
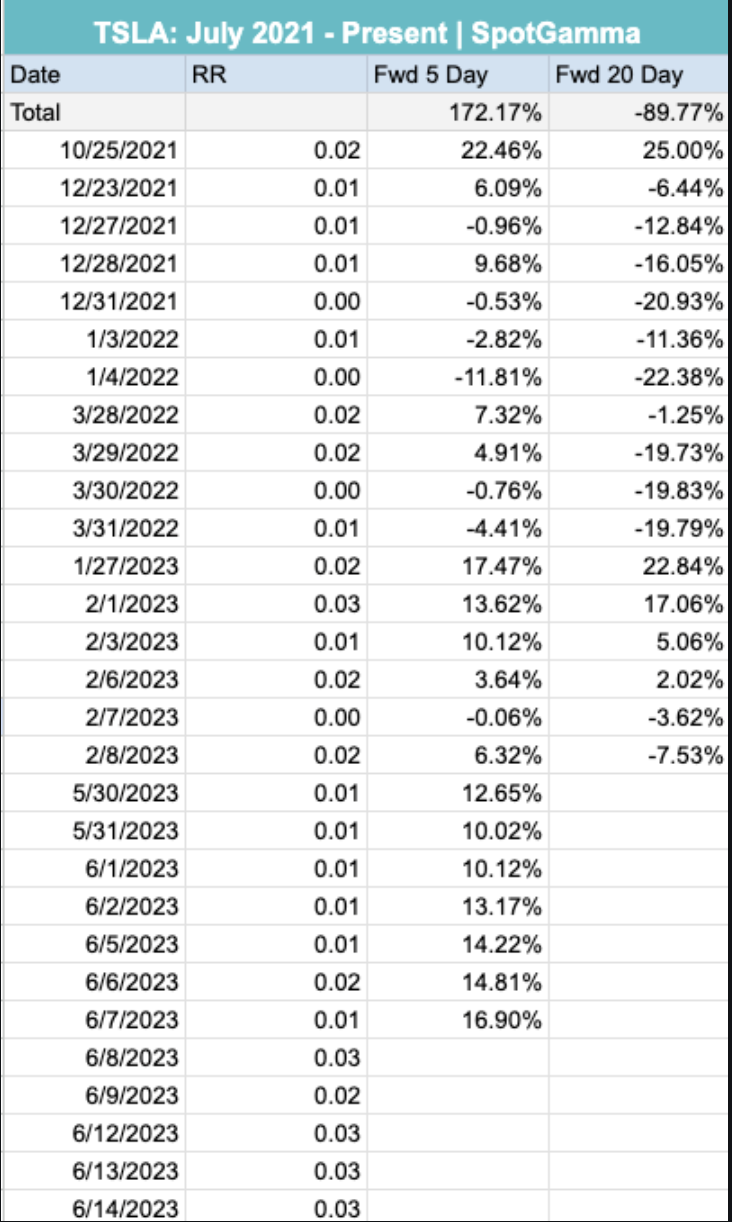
Here is a table showing the forward returns of the stock after these periods. On a short term (1-5 days) basis, the RR>0 seems to be a fantastic long signal as traders grab for calls. However on a longer term basis this momentum trade then ends badly, as seen in the Forward 20 day returns.
You may note that in this particular case the “strategy” (i.e. short when RR>0) did not do well in early ’23 but this is when the stock was coming off of major lows, induced by Elon taking over Twitter (chart here).
Currently, we entered this RR>0 condition essentially back on June 1st, and TSLA is now up +50% since that date. In our view, what finally breaks this TSLA trend is OPEX, wherein large call positions are set to expire.
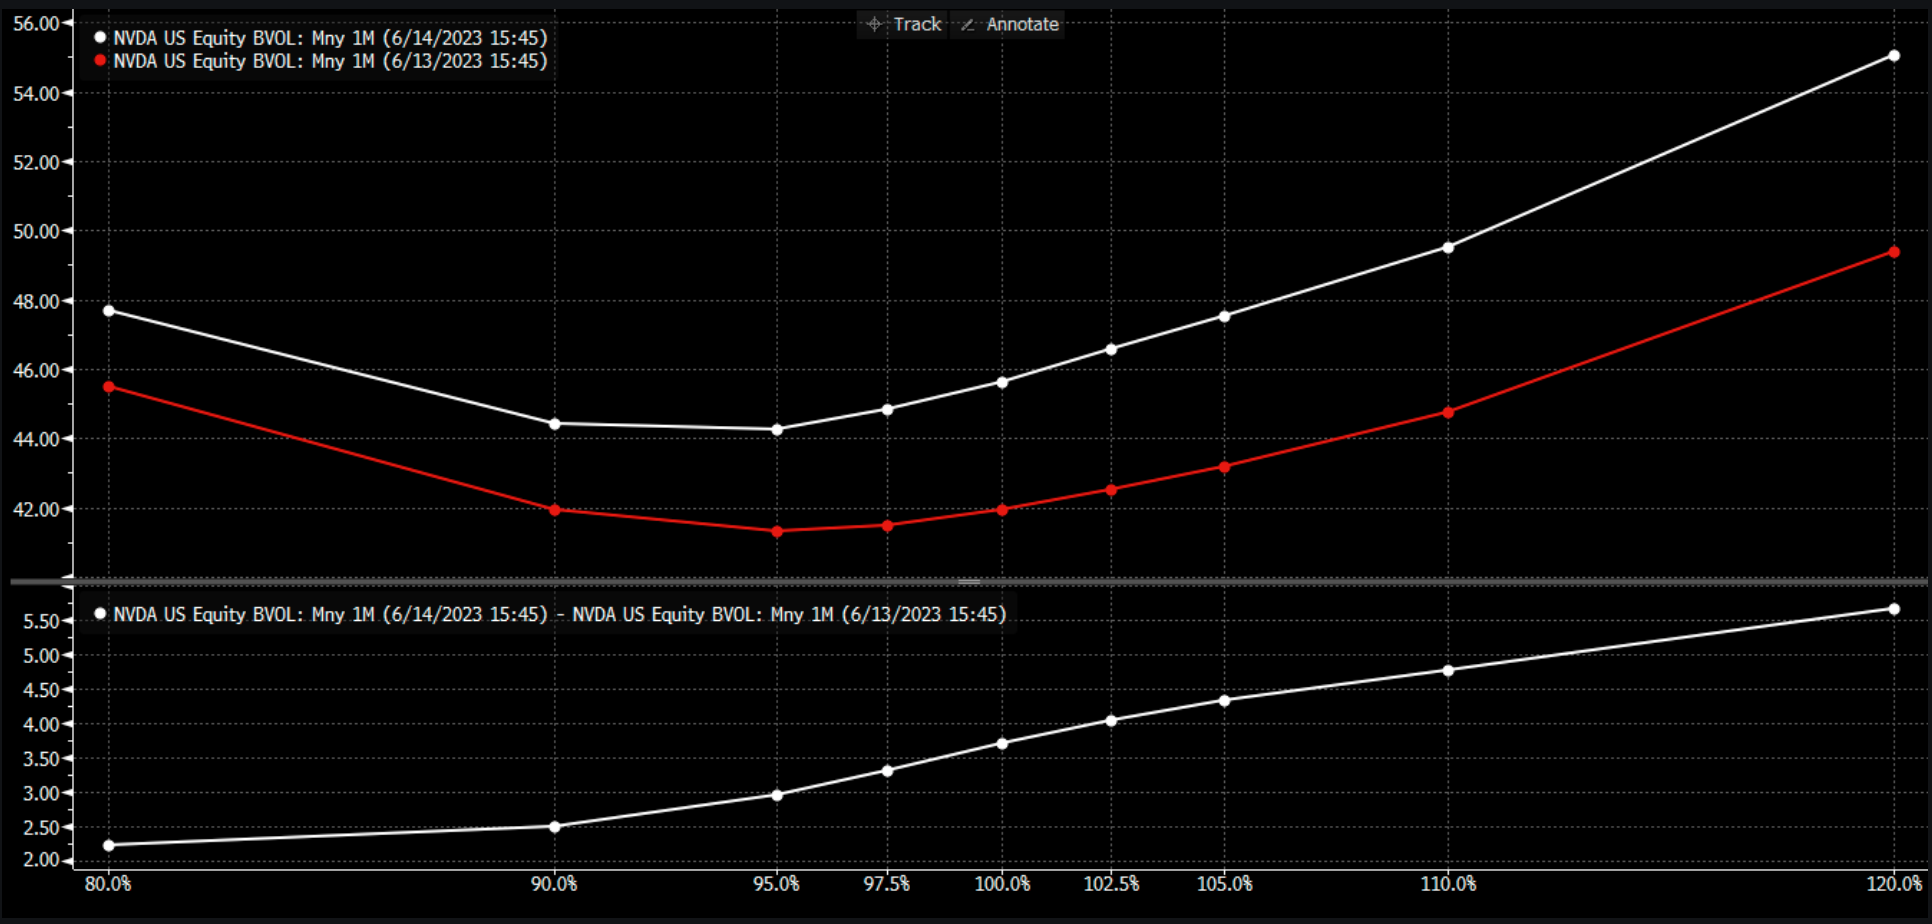
Another fantastic example of this is in NVDA, as upside strike IV’s surged yesterday following the Fed’s pause (NVDA stock +4.8% on day). Calls are getting increasingly more expensive as the stock surges higher – the prices you pay to get long calls are getting exponentially more expensive.
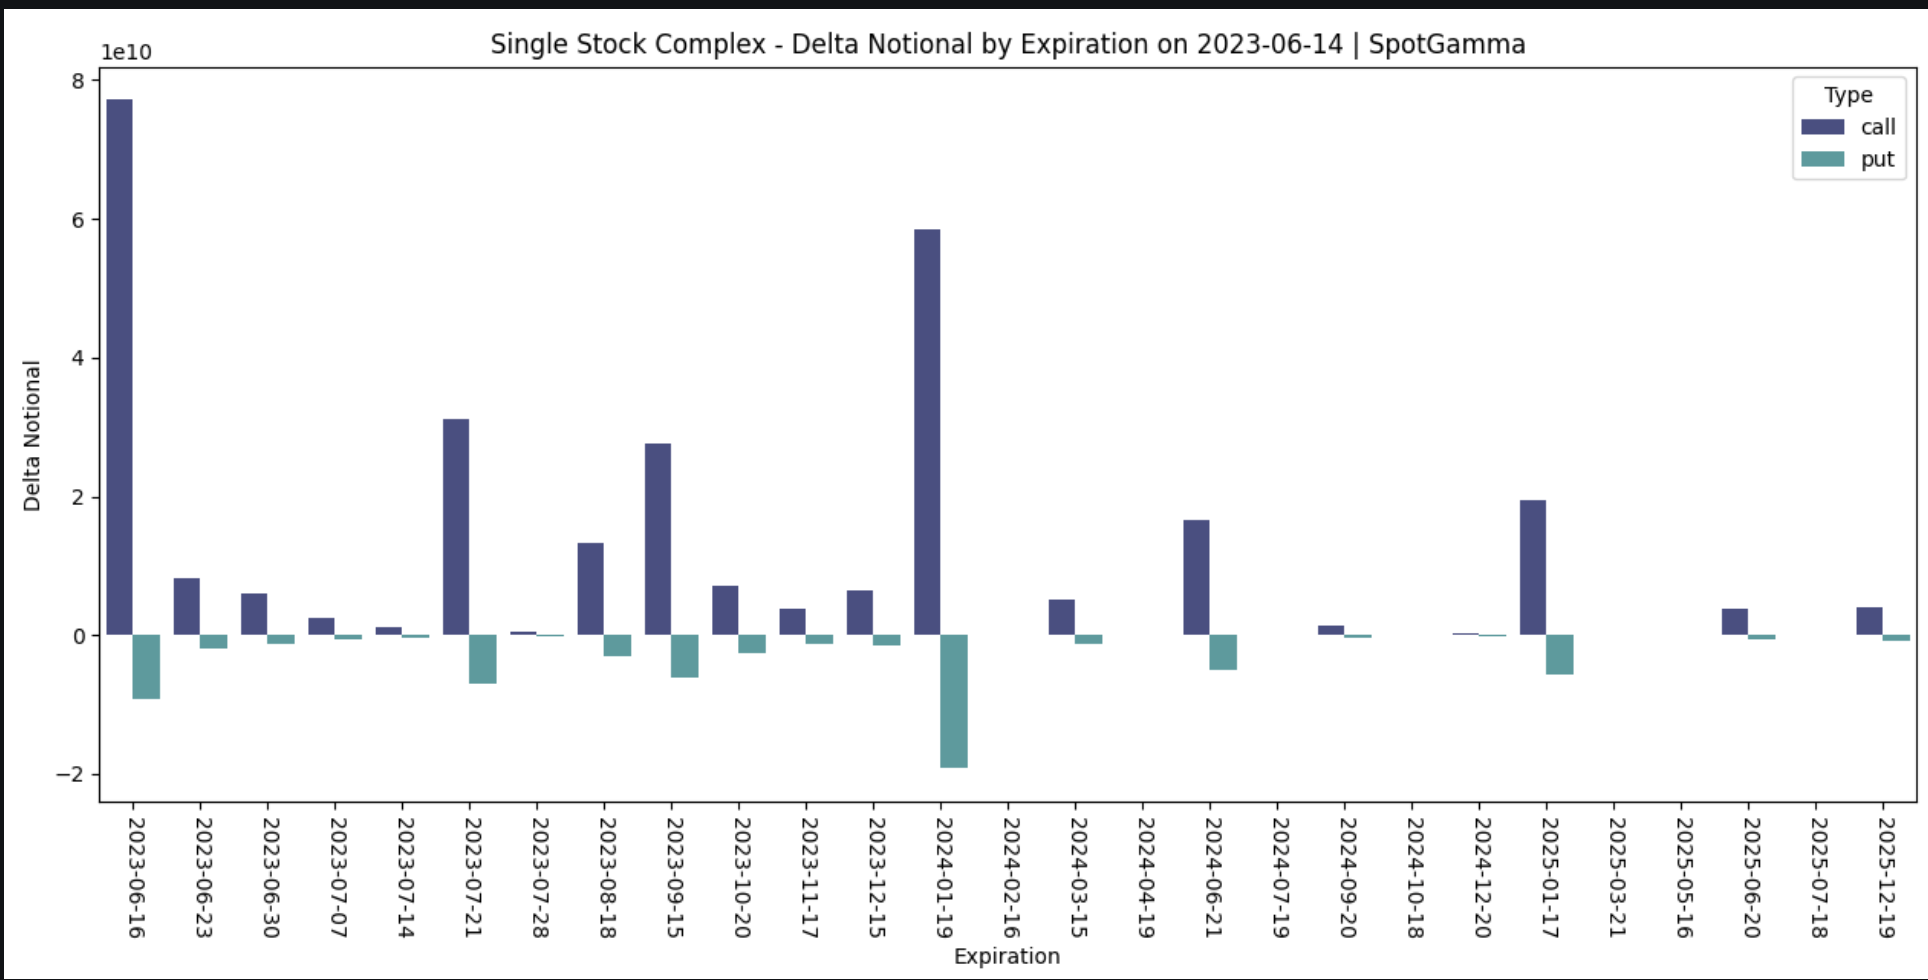
This leads us to our core point. We do not take a fundamental view or technical view on markets – its the options market that seems to be a crowded, call-heavy long which shows prices that appear ripe for consolidation. Summarizing this is single stock delta notional for June OPEX, which added several billion more yesterday.
None of this means that we see a dramatic end to a bull run, but instead look for consolidation and a reset to more reasonable (and sustainable) options prices.
| SpotGamma Proprietary Levels | SPX | SPY | NDX | QQQ | RUT | IWM |
|---|---|---|---|---|---|---|
| Reference Price: | $4372 | $437 | $15006 | $365 | $1874 | $185 |
| SpotGamma Implied 1-Day Move: | 0.83% | 0.83% |
|
|
|
|
| SpotGamma Implied 5-Day Move: | 2.18% |
|
|
|
|
|
| SpotGamma Volatility Trigger™: | $4245 | $434 | $14490 | $362 | $1880 | $183 |
| Absolute Gamma Strike: | $4400 | $440 | $15125 | $360 | $1890 | $185 |
| SpotGamma Call Wall: | $4400 | $440 | $15125 | $370 | $1790 | $190 |
| SpotGamma Put Wall: | $4000 | $430 | $13800 | $325 | $1850 | $170 |
| Additional Key Levels | SPX | SPY | NDX | QQQ | RUT | IWM |
|---|---|---|---|---|---|---|
| Zero Gamma Level: | $4282 | $433 | $0 | $362 | $1855 | $185 |
| Gamma Tilt: | 1.778 | 1.334 | 3.37 | 1.065 | 0.946 | 1.054 |
| SpotGamma Gamma Index™: | 3.022 | 0.267 | 0.134 | 0.020 | -0.005 | 0.009 |
| Gamma Notional (MM): | $1.293B | $1.139B | $18.261M | $154.568M | $3.653M | $45.74M |
| 25 Day Risk Reversal: | -0.025 | -0.024 | -0.018 | -0.021 | -0.003 | -0.008 |
| Call Volume: | 714.015K | 2.679M | 9.54K | 875.622K | 16.457K | 489.476K |
| Put Volume: | 1.062M | 3.173M | 10.872K | 1.687M | 20.99K | 594.942K |
| Call Open Interest: | 7.105M | 7.829M | 74.25K | 5.429M | 244.832K | 4.241M |
| Put Open Interest: | 13.693M | 15.311M | 77.96K | 11.20M | 403.948K | 8.45M |
| Key Support & Resistance Strikes |
|---|
| SPX Levels: [4400, 4375, 4350, 4300] |
| SPY Levels: [440, 436, 435, 430] |
| NDX Levels: [15150, 15125, 15100, 15000] |
| QQQ Levels: [365, 360, 355, 350] |
| SPX Combos: [(4574,81.90), (4552,93.21), (4526,89.76), (4499,99.22), (4473,91.30), (4460,77.71), (4451,99.44), (4447,74.39), (4438,85.70), (4429,87.92), (4425,98.48), (4421,96.48), (4416,83.04), (4412,95.53), (4403,83.37), (4399,99.98), (4394,83.04), (4390,93.09), (4386,75.33), (4381,93.56), (4377,99.00), (4368,91.66), (4364,83.48), (4359,95.64), (4351,99.18), (4346,86.01), (4324,93.48), (4320,99.13), (4311,76.14), (4303,79.46), (4298,97.52), (4202,91.12)] |
| SPY Combos: [440.25, 435.44, 437.63, 445.5] |
| NDX Combos: [15126, 15096, 15171, 15381] |
| QQQ Combos: [368.9, 369.63, 365.99, 371.09] |
0 comentarios