Macro Theme:
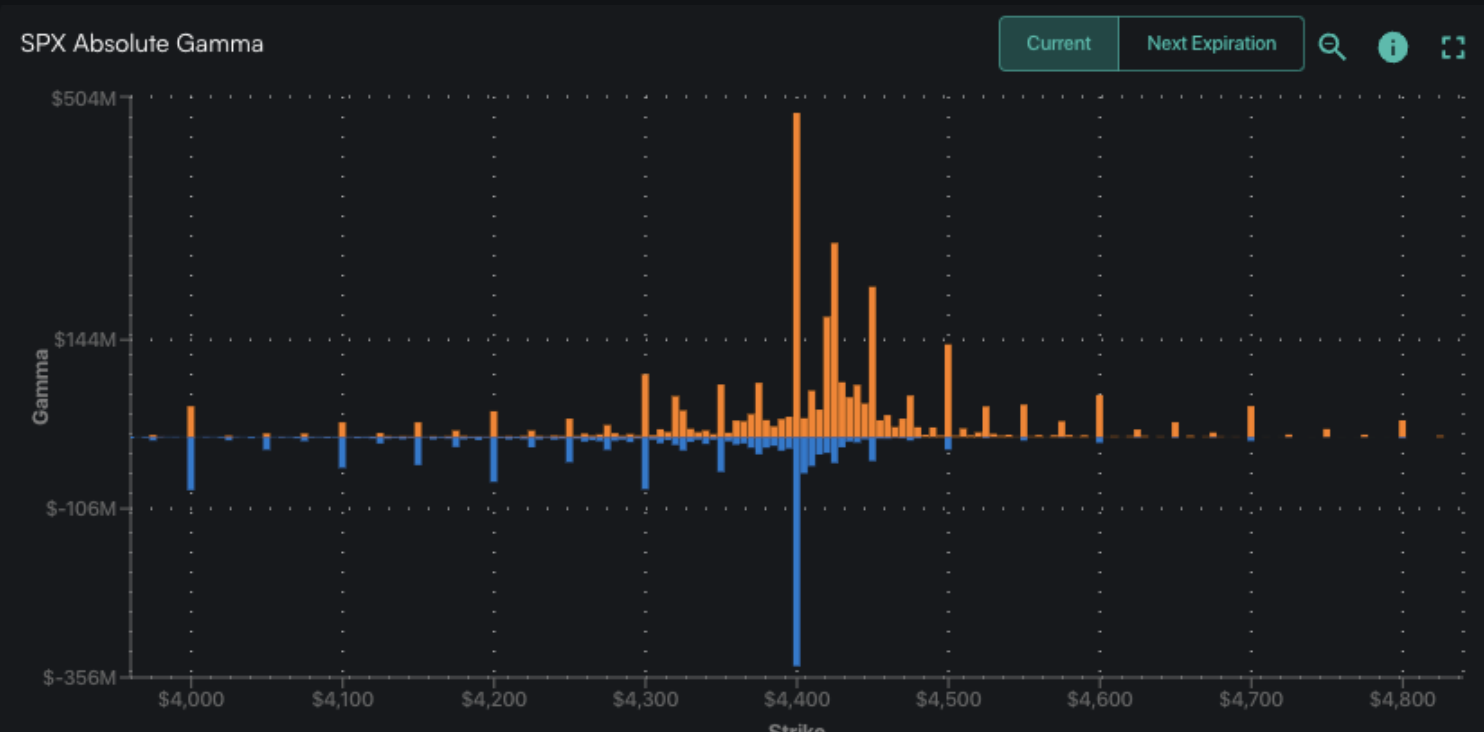
Major Resistance: $4,425 Call Wall
Pivot Level: $4,400
Interim Support: $4,300
Range High: $4,425 Call Wall
Range Low: $4,000 Put Wall
‣ We are neutral on the S&P, and looking for a window of weakness post 6/14 FOMC & 6/16 OPEX
‣ Much of our data into 6/16 suggests that call buying is at major extremes, backing our views for a market correction
Founder’s Note:
Futures are flat to 4,470 ahead of this mornings large 9:30 AM ET SPX Index expiration. The Call Walls have jumped higher to 4,425 for the SPX, and 450 for the SPY which are resistance points for today. Support shows at 4,400, then 4,350.
In QQQ resistance is at the 375 Call Wall, with support at 365.
With yesterdays rally, call positions filled in >4,400, and we saw a large amount of puts added at that strike, too (likely shorts). This has added transient positions above 4,400 – we mark them as transient as the +30% SPX gamma is tied to todays expiration.
We have admittedly been looking for a window of weakness to open into and after this expiration, and yesterdays action has, 1 day in, countered that view. We strive to not carry a directional bias – our role here is to assess which way options flows were impacting markets in the past, and how they may influence price action looking forward.
That said, what’s happening now, through an options lens, has been driving markets higher and is now bordering on the absurd.
Yesterday’s AM note discussed the elevated call IV’s across many single stocks, and yesterday that froth rolled into the S&P.
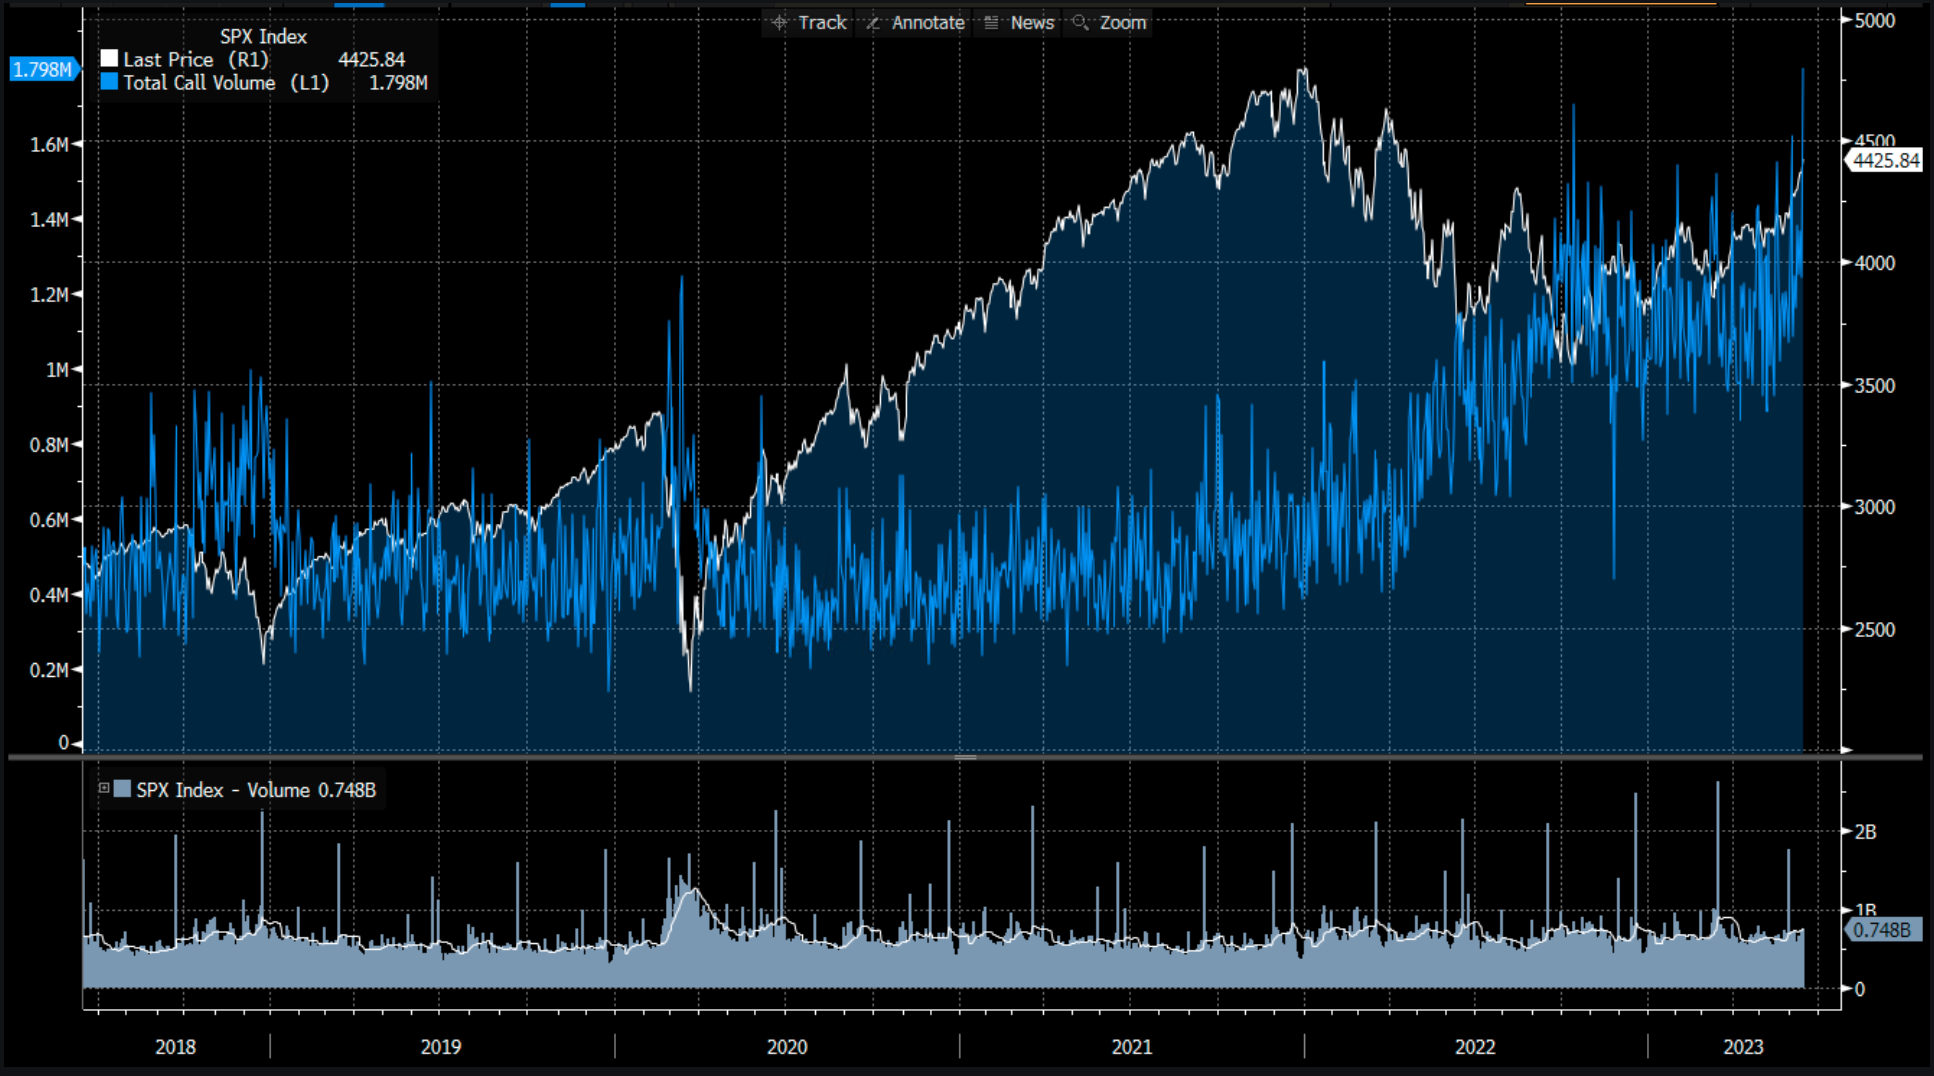
Exhibit A, yesterday was the highest SPX call volume on record (blue).
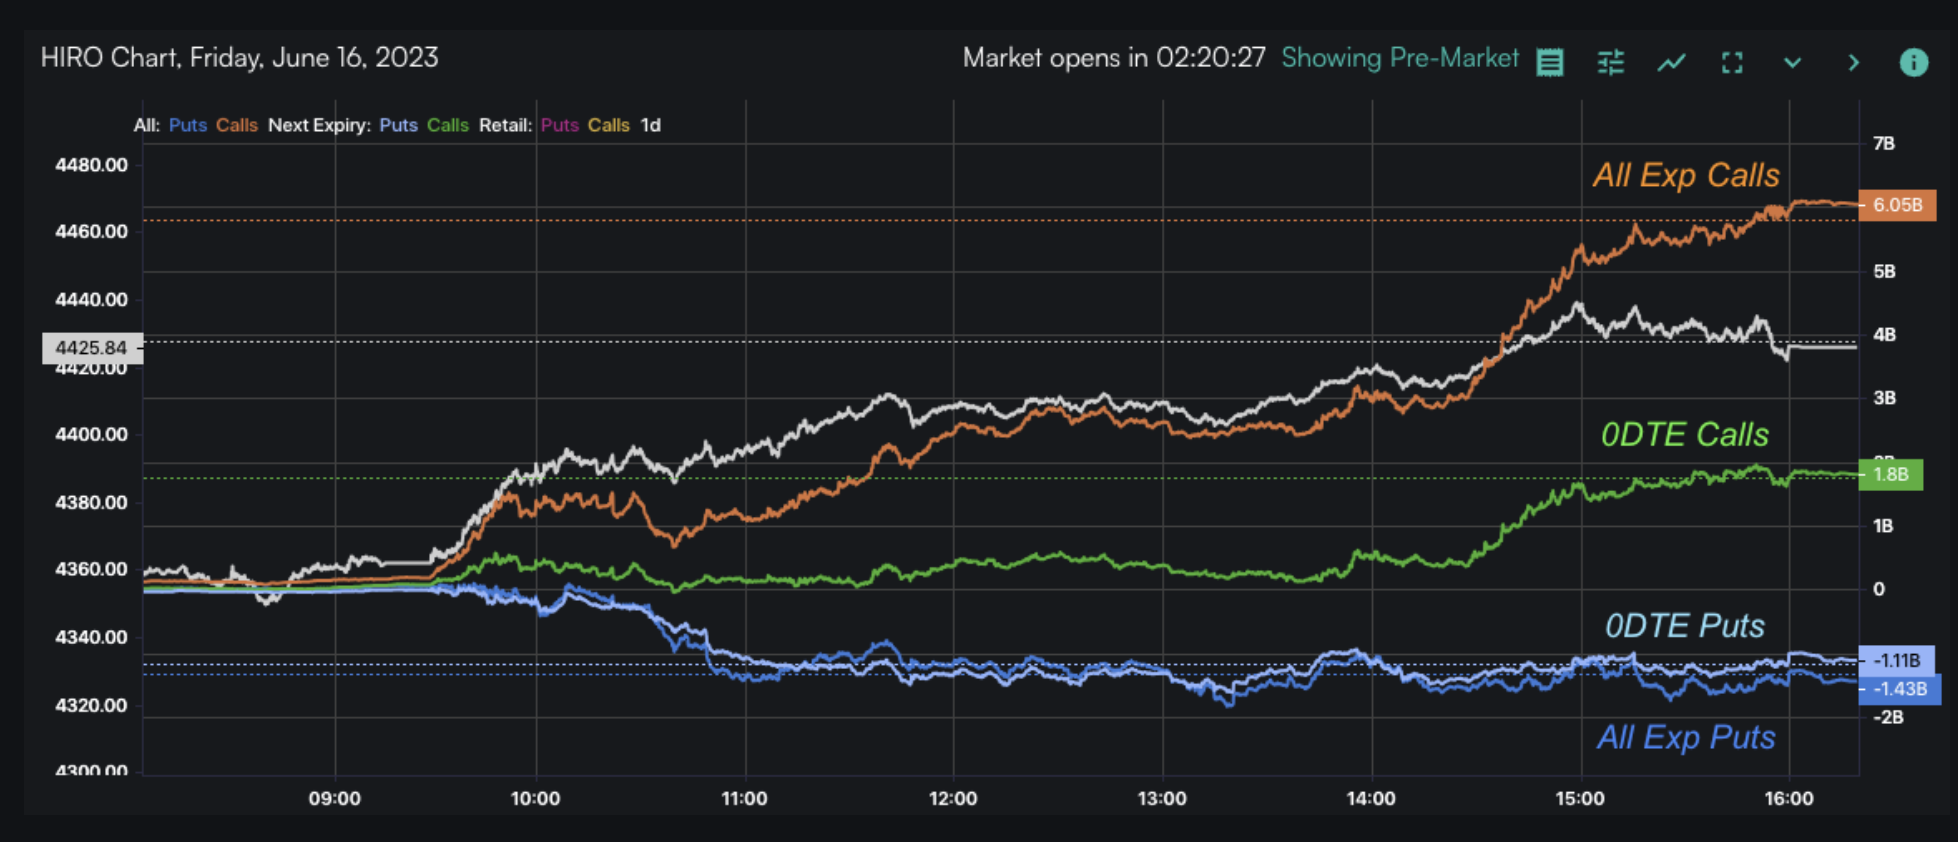
Looking at HIRO, we saw massive non-0DTE call volume (orange), which on first blush gives the appearance of structural long term call buyers.
Also note that net put delta outside of 0DTE was non existent. This is seen through the fact that the 0DTE put line (light blue) and all expiration put line (dark blue) are have no spread between them. Stated another way – no one was buying puts > 6/15 exp.
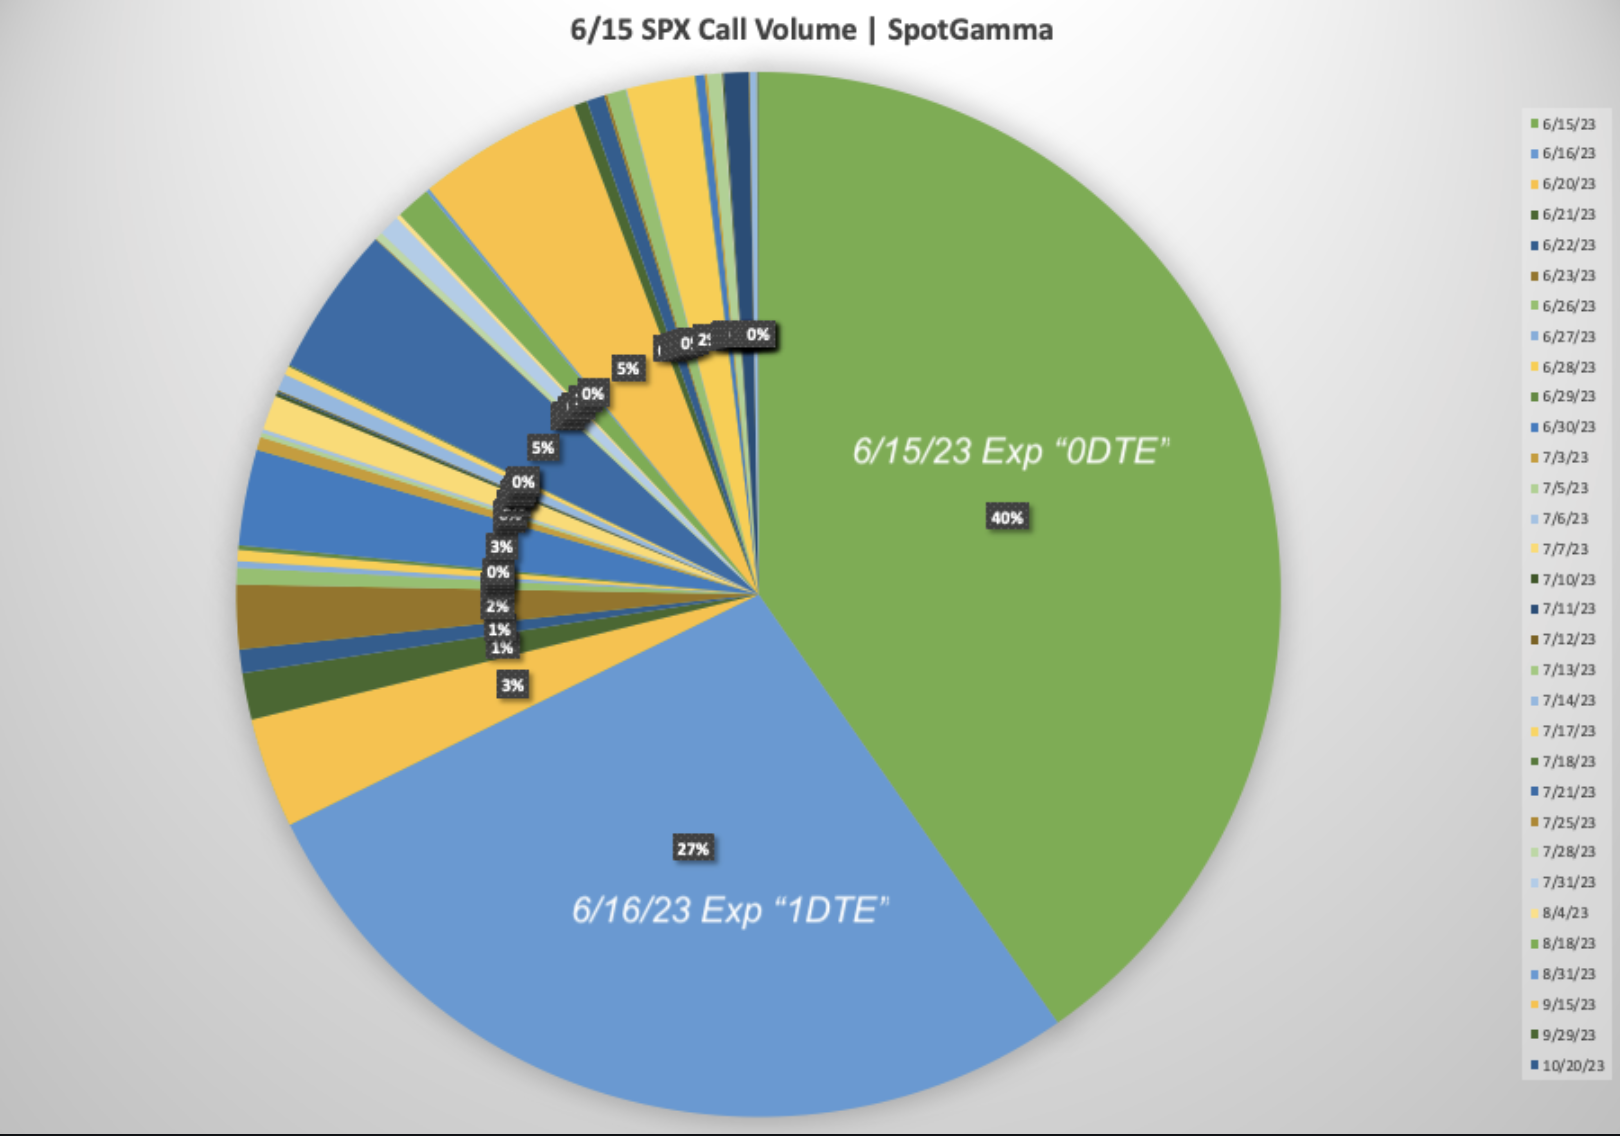
Back to that idea of long term call buyers, we broke down the percentage of call volume by expiration below. 67% of SPX call volume was tied to 0DTE(green) & 1DTE(blue). One could make the argument that while volume is concentrated in daily contracts, HIRO is a measurement of delta which signals there was some “real money” (i.e. non-daily) at work.
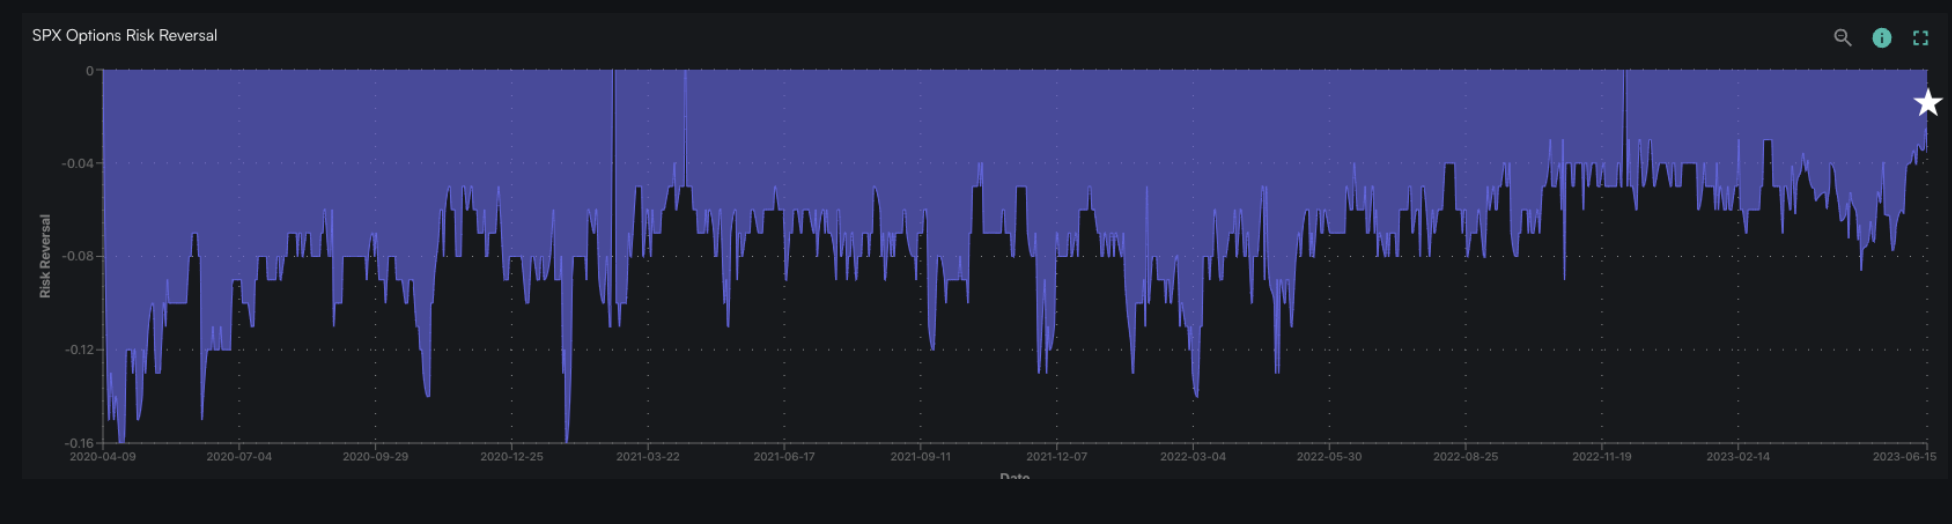
Reflecting this “not pure daily” argument, our risk reversal reading for the SPX is now at its highest level ever (going back to 4/20). This is telling us that the prices being paid for a 1 month 25 delta call relative to a 1 month 25 delta put is now higher than at any of those liquidity fueled, meme fueled manias of 2020/21.
Driving this all home is this plot, which shows the correlation between the SPX & VIX. “VIX up, market up” is a surefire signal of heavy long call demand and/or large upside dealer exposure.
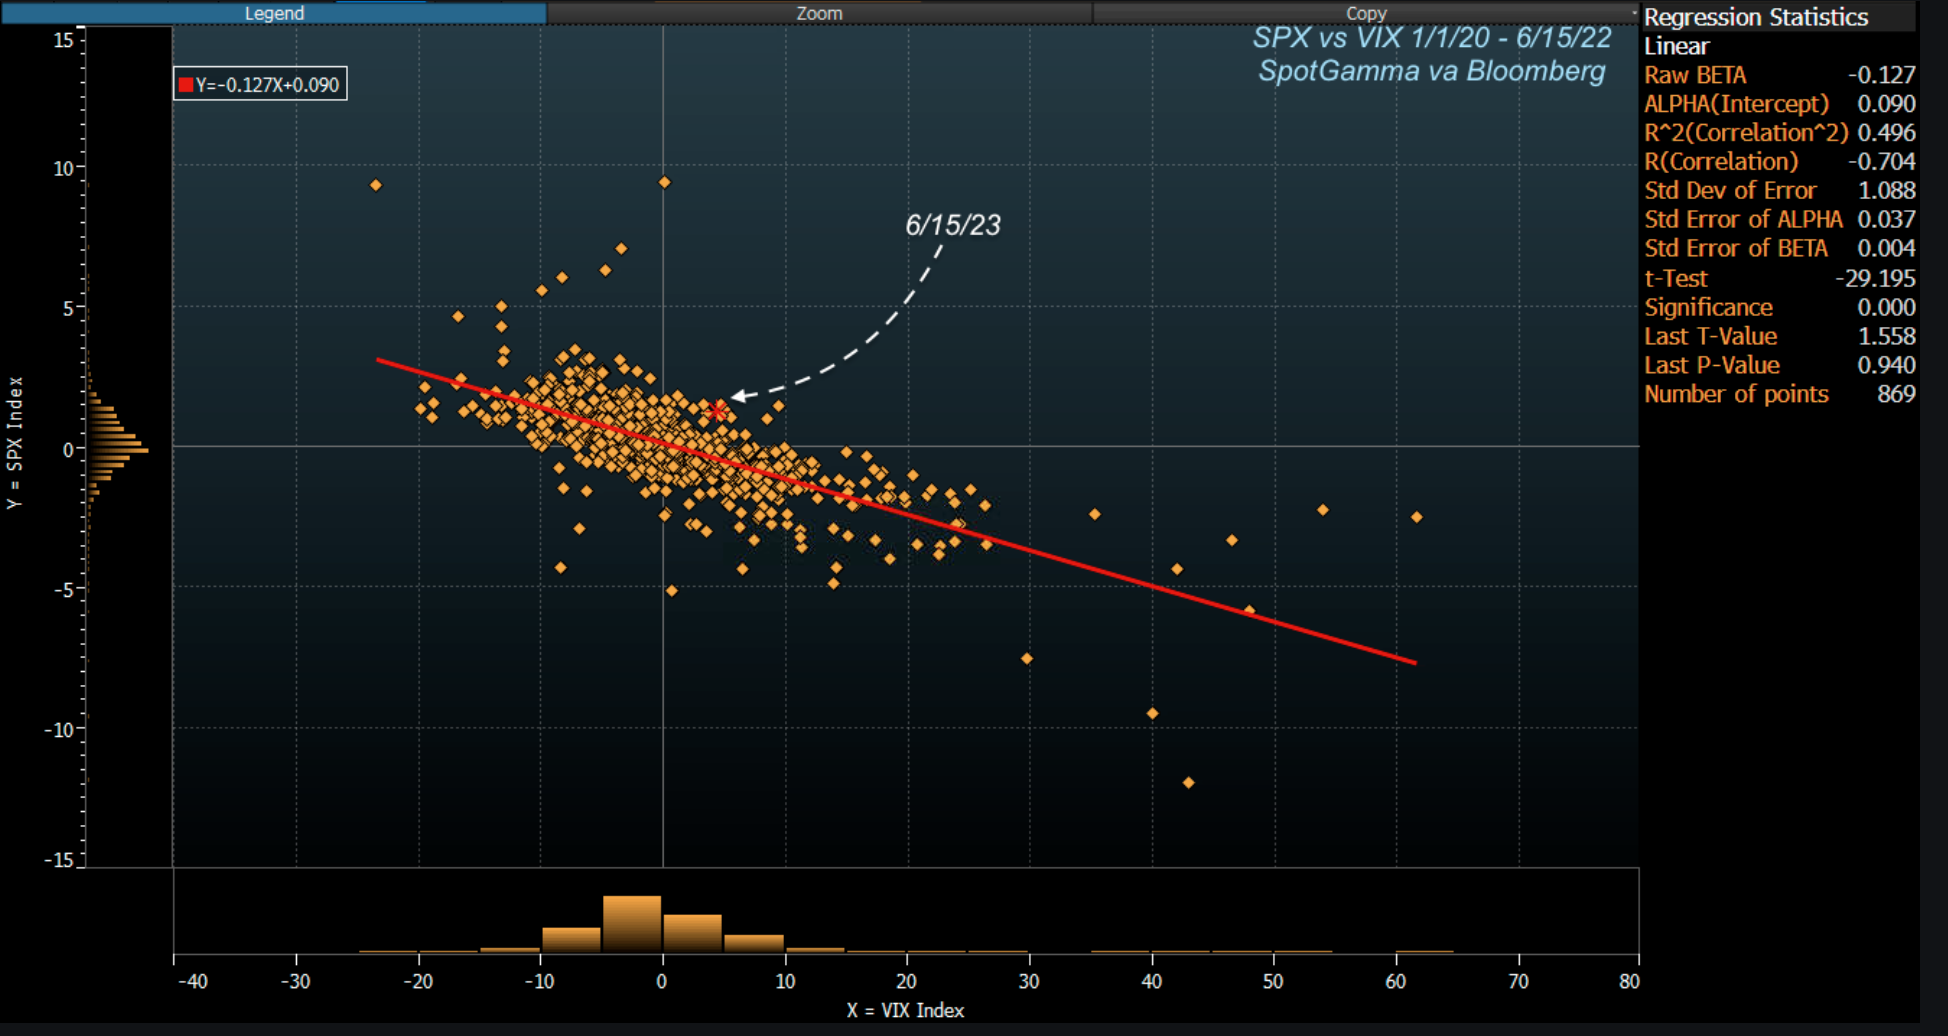
However you cut it, this is all at extremes. These extremes bolster our view that markets are due for a correction, and we are aware that any correction may be taking place from a market that is now 1-2% higher due to yesterday’s rally.
The argument for a pull back here is of course driven by today’s expiration, which now sees a massive amount of call delta’s set to expire which could reduce upside momentum.
| SPX | SPY | NDX | QQQ | RUT | IWM | |
|---|---|---|---|---|---|---|
| Reference Price: | $4426 | $442 | $15185 | $370 | $1888 | $187 |
| SpotGamma Implied 1-Day Move: | 0.85% | 0.85% |
|
|
|
|
| SpotGamma Implied 5-Day Move: | 2.18% |
|
|
|
|
|
| SpotGamma Volatility Trigger™: | $4295 | $439 | $14840 | $362 | $1800 | $184 |
| Absolute Gamma Strike: | $4400 | $440 | $15125 | $370 | $1890 | $185 |
| SpotGamma Call Wall: | $4425 | $450 | $15125 | $375 | $1890 | $190 |
| SpotGamma Put Wall: | $4000 | $430 | $14475 | $325 | $1750 | $170 |
| Additional Key Levels | SPX | SPY | NDX | QQQ | RUT | IWM |
|---|---|---|---|---|---|---|
| Zero Gamma Level: | $4367 | $438 | $0 | $369 | $1855 | $184 |
| Gamma Tilt: | 1.826 | 0.911 | 3.586 | 1.101 | 1.029 | 1.122 |
| SpotGamma Gamma Index™: | 3.198 | -0.062 | 0.150 | 0.029 | 0.002 | 0.019 |
| Gamma Notional (MM): | $642.687M | $464.336M | $15.051M | ‑$57.017M | $13.561M | $152.643M |
| 25 Day Risk Reversal: | -0.036 | -0.035 | -0.025 | -0.026 | -0.008 | -0.019 |
| Call Volume: | 974.652K | 2.127M | 20.217K | 1.07M | 17.151K | 570.914K |
| Put Volume: | 1.499M | 3.597M | 14.925K | 1.539M | 22.095K | 554.245K |
| Call Open Interest: | 5.671M | 5.872M | 71.65K | 5.124M | 249.711K | 3.89M |
| Put Open Interest: | 14.521M | 15.643M | 82.164K | 11.468M | 414.804K | 8.597M |
| Key Support & Resistance Strikes |
|---|
| SPX Levels: [4450, 4425, 4420, 4400] |
| SPY Levels: [442, 440, 435, 430] |
| NDX Levels: [15150, 15125, 15100, 15000] |
| QQQ Levels: [370, 365, 360, 350] |
| SPX Combos: [(4599,96.78), (4577,84.75), (4550,95.10), (4524,93.83), (4502,99.61), (4480,83.95), (4475,95.92), (4471,87.90), (4462,92.09), (4457,84.67), (4453,76.08), (4449,99.86), (4444,94.34), (4440,98.12), (4435,95.38), (4431,98.10), (4426,99.97), (4422,99.83), (4418,75.02), (4409,87.45), (4404,87.64), (4400,99.75), (4378,95.65), (4351,84.43), (4325,81.29), (4320,94.20), (4249,78.69)] |
| SPY Combos: [445.26, 450.57, 455.44, 440.39] |
| NDX Combos: [15125, 15094, 15383, 15261] |
| QQQ Combos: [374.17, 373.43, 375.28, 380.48] |
0 comentarios