
Macro Theme:
Short Term Resistance: 4,550 – 4,565
Short Term Support: 4,500
Risk Pivot Level: 4,500 – 4,515 (SPY 450)
Major Range High/Resistance: 4,600
Major Range Low/Support: 4,400
‣ A window of weakness may open with 7/19 VIX expiration, in through the following week (7/24) which may result in a break <4,500
‣ The bullish case remains intact with SPX >4,500*
‣ Risk shifts higher on a break of 4,500, wherein we would look for a test of 4,400 with a VIX shift towards 20*
*updated 7/24
Founder’s Note:
ES futures are off fractionally to 4,590. For today, FOMC day, first resistance is at 4,565 (SPY 455), then 4,577. Our
Call Walls
hold at 4,600 – 4,615 (SPY 460) which is the top end of our trading range. Support below shows at 4,550, then down at 4,515 (SPY 450) – 4,500. We see the 4,500 level as material support. A break of 4,500 shifts risk materially higher.
In QQQ support is at 375, with resistance at 379 – 380. The QQQ
Call Wall
has jumped to 400, a level which nearly marks the Nov ’21 all time highs (QQQ ATH = 408). This 400 area may be a high to note into August expiration.
As we have been discussing for a few weeks, the market is exhibiting extreme levels of complacency. This is a theme now being echoed by the banks, too. The chart below comes from a BofA piece, wherein they note that 1 year 95% SPX, and 1 year 95% – 75% put spreads are the cheapest they’ve seen since 2008 (when their data began).

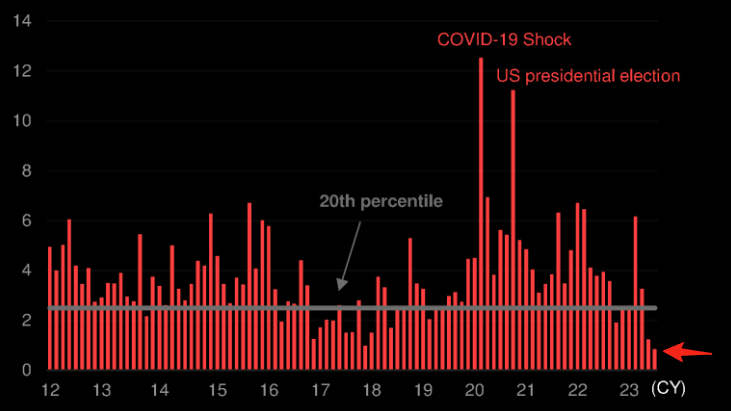
While the metric above is around long dated puts, the short term estimated event volatility has plummeted, too. Shown here is the “SPX 1 week implied volatility skew” around FOMC days (h/t TME), and as you can see it rivals depths not seen since ’17 (a year when the VIX hit all-time lows). Further, today’s 0DTE straddle is pricing a one day SPX move at 66bps (ref: 4560, IV 25%) which is the lowest since Nov ’21 (per Citi).
As the trading axiom goes: “low price does not mean cheap”, which is the relevant for volatility, too. In this case we currently have 1 month SPX realized volatility at ~9%, which tells us that average daily moves in the SPX have been ~60bps. Through this lens if the 0DTE straddle forecasts ~66bps and realized daily moves have been ~60bps the market is pricing today as essentially an average trading day. There is probably little to be gained from selling short dated volatility into FOMC.
That being said, there have been brief windows of time wherein 1 month realized has slid lower, including Oct ’17 (all time realized low of ~3.5%), Oct ’18 (~5%) Nov ’19 (~5%) & Nov ’21 (~6%). This suggests that “grind lower” (in vol terms) is certainly possible, and there is a theme of realized lows into the Oct/Nov window.
Through this lens, should the Fed appease traders today, its reasonable to anticipate that vols grind down and we likely test the 4,600
Call Wall
by Friday, and then traders may eyeball lower realized volatility into end-of-year.
Even with “even lower volatility” a decent possibility, we’d all likely bet the farm that volatility is going to go higher at some point in the future. One could also argue that with IV at these lows the carry cost of protection is reasonable, as puts would be subject to time decay, but not much of a vega drag if implied’s come in further.
In this case, we see that “some point” as a break of 4,500, which is currently our
Put Wall
strike. It’s below this level wherein we start to see the balance of options positioning shift to puts (blue bars below, vs calls in orange), which could trigger a short volatility unwind and/or long volatility demand and a quick test of 4,400 (see Monday’s note).

| SpotGamma Proprietary Levels | SPX | SPY | NDX | QQQ | RUT | IWM |
|---|---|---|---|---|---|---|
| Reference Price: | $4567 | $455 | $15561 | $378 | $1966 | $194 |
| SpotGamma Implied 1-Day Move: | 0.82% | 0.82% |
|
|
|
|
| SpotGamma Implied 5-Day Move: | 2.11% |
|
|
|
|
|
| SpotGamma Volatility Trigger™: | $4540 | $455 | $15250 | $375 | $1950 | $194 |
| Absolute Gamma Strike: | $4600 | $450 | $15475 | $400 | $1970 | $195 |
| SpotGamma Call Wall: | $4600 | $460 | $15475 | $400 | $1970 | $200 |
| SpotGamma Put Wall: | $4500 | $450 | $15200 | $355 | $1800 | $170 |
| Additional Key Levels | SPX | SPY | NDX | QQQ | RUT | IWM |
|---|---|---|---|---|---|---|
| Zero Gamma Level: | $4507 | $454 | $14396 | $364 | $1991 | $194 |
| Gamma Tilt: | 1.328 | 0.887 | 1.942 | 1.103 | 0.878 | 0.935 |
| SpotGamma Gamma Index™: | 1.496 | -0.103 | 0.061 | 0.003 | -0.008 | -0.009 |
| Gamma Notional (MM): | $451.026M | ‑$411.178M | $7.934M | $23.113M | ‑$6.923M | ‑$65.432M |
| 25 Day Risk Reversal: | -0.03 | -0.022 | -0.023 | -0.015 | -0.017 | -0.016 |
| Call Volume: | 424.704K | 1.078M | 5.871K | 604.041K | 10.999K | 261.663K |
| Put Volume: | 691.52K | 1.657M | 8.642K | 710.804K | 13.364K | 258.835K |
| Call Open Interest: | 5.923M | 6.479M | 54.857K | 1.063M | 183.78K | 3.488M |
| Put Open Interest: | 12.114M | 13.404M | 65.203K | 1.668M | 343.426K | 6.853M |
| Key Support & Resistance Strikes |
|---|
| SPX Levels: [4600, 4550, 4500, 4400] |
| SPY Levels: [460, 455, 450, 445] |
| NDX Levels: [16500, 16000, 15475, 15000] |
| QQQ Levels: [400, 390, 380, 370] |
| SPX Combos: [(4750,92.71), (4723,76.28), (4700,98.52), (4677,87.85), (4668,80.70), (4663,95.21), (4650,98.67), (4641,90.66), (4636,75.10), (4631,90.34), (4627,97.57), (4622,93.68), (4613,94.55), (4609,91.76), (4604,84.99), (4599,99.45), (4595,84.48), (4581,82.32), (4577,96.30), (4572,83.74), (4549,93.38), (4513,80.69), (4504,81.22), (4499,92.27)] |
| SPY Combos: [459.98, 457.25, 470, 464.99] |
| NDX Combos: [15561.42, 15561.42, 15561.42, 15561.42] |
| QQQ Combos: [379.63, 377.73, 387.58, 372.43] |
0 comentarios