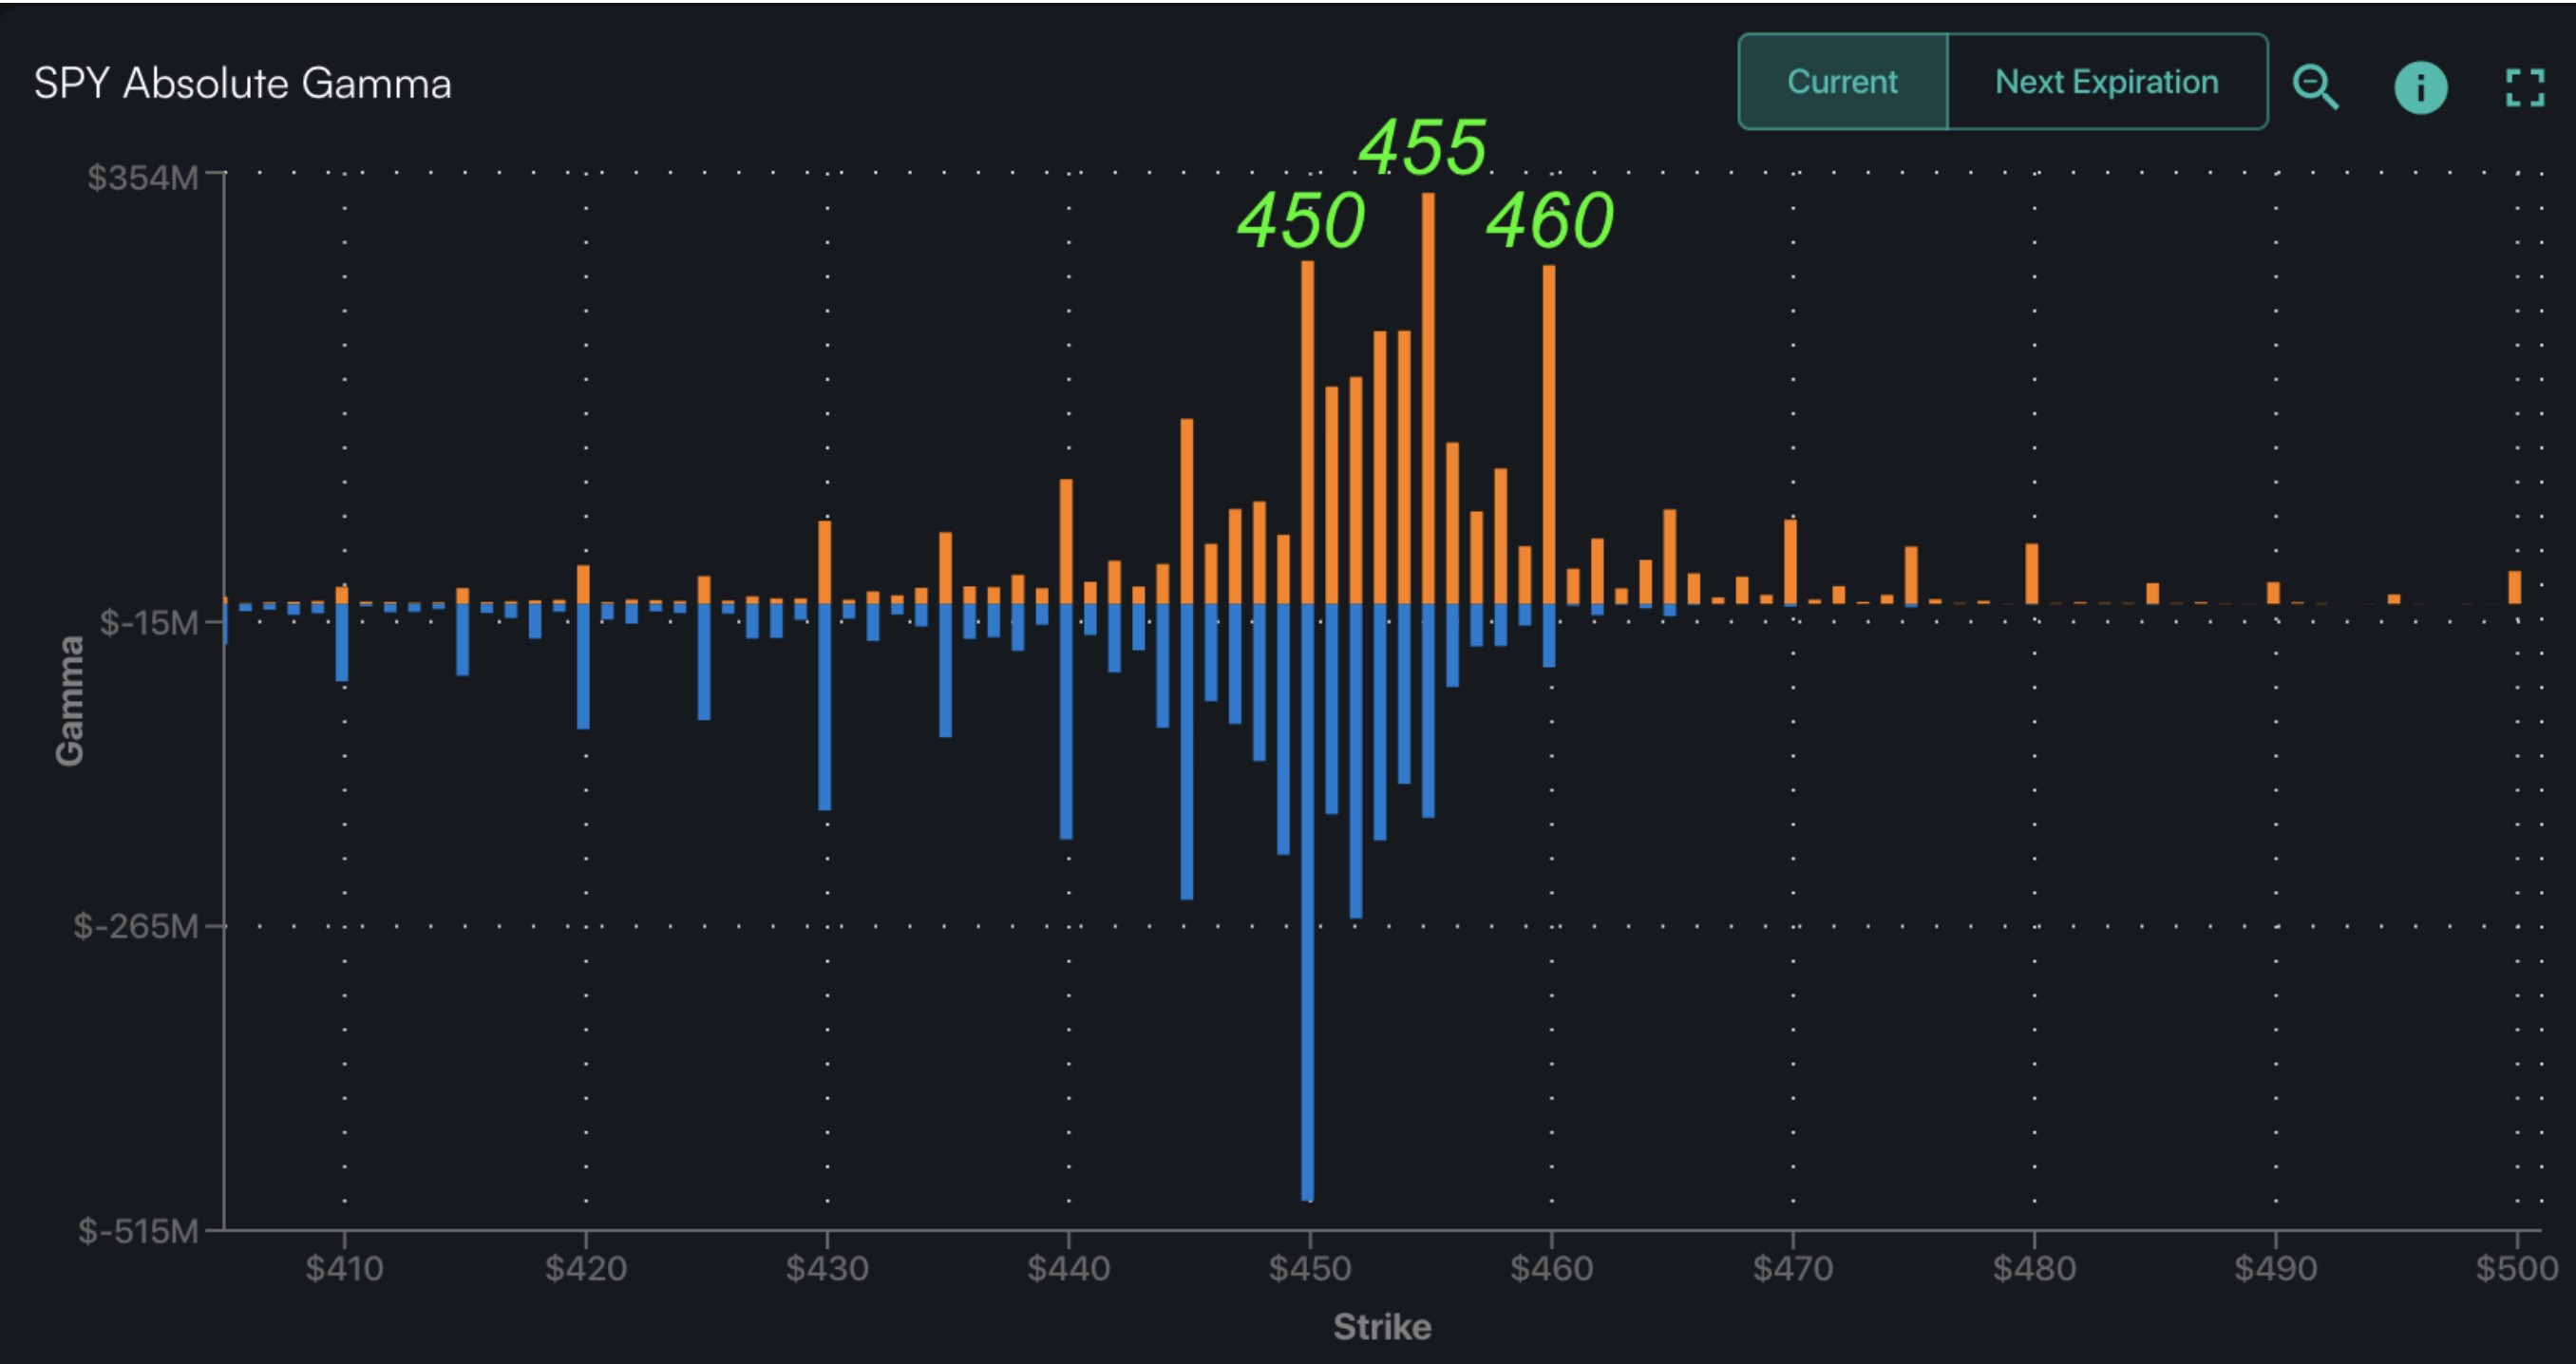
Short Term Resistance: 4,600 Call Wall – 4,615 (SPY 460 Call Wall)
Short Term Support: 4,550
Risk Pivot Level: 4,500 – 4,515 (SPY 450)
Major Range High/Resistance: 4,615
Major Range Low/Support: 4,400
‣ The bullish case remains intact with SPX >4,500* and a current upside target of the major 4,600 Call Wall**
‣ As realized volatility shifts lower, it suggests implied volatility should grind down, too. This may result in mid-12 VIX.**
‣ Risk shifts higher on a break of 4,500, wherein we would look for a test of 4,400 with a VIX shift towards 20*
*updated 7/24
**updated 7/27
Founder’s Note:
Futures are up 30bps to 4,580. Key SG levels remain largely the same, with 4,550 – 4,565 (SPY 455) setting up as the first resistance area, followed by the 4,600
Call Wall.
Support below shows at 4,515 (SPY450) – 4,500. Our models continue to estimate fairly low volatility sessions, with a maximum open/close range of 79bps.
In QQQ, 379/380 is first resistance, with our top being the 385
Call Wall.
Support shows at 375.
Eyes are on bond markets today, as the BOJ shifts policy around. While we aren’t here to comment on BOJ policy, one does have to be aware that further volatility in that region/asset can spill over into US equities. To this point the VIX spiked from the high 12’s up to 15 yesterday as the BOJ policy change was first noted.
This is a short glimpse of the jump risk embedded in today’s equity volatility market, as traders who are SPX short volatility at 8% have little room for error. At 8% IV anything more than a 50bps SPX move pushes that vol price offsides, which can spark covering. This means that whats normally a small move down bumps into something with a little more teeth.
But, TLDR, it doesn’t read like yesterday sparked long term volatility demand as vols are lower.
Digging in, we’ve plotted SPX fixed strike volatility below. In green are the readings from yesterday AM, when the SPX was at the days highs of 4,600. Red shows yesterdays closing IV’s, wherein the SPX was down near 4,540.
The yellow arrow shows the natural slide higher in IV’s that would occur if you shifted the SPX lower (sliding up the IV skew, so to speak). However, we can see that by the end of the day that 4,540 IV was higher by the difference highlighted in the yellow box. In other words – vols were indeed higher (which is probably not a surprise).
However this AM (white) it looks like fixed strike vol shows lower across the board.
In regards to the still elevated AM VIX (which gives a larger weighting to at-the-money SPX options), its still higher because the at-the-money’s were ~4,600’s, but now at-the-moneys are ~4,550’s. The purple box highlights that the 4,550 IV is lower from yesterday which is probably not what you’d see if traders were looking for further market damage.
We’re currently operating from the stance that equities & volatility will mean revert here due to a mild positive gamma position, and traders trying to take advantage of any slightly elevated vol in front of a summer weekend.
A break of 4,500 is where we’d change this view, as below there is where we’d look for negative gamma hedging flows which could drive markets lower. This would likely link with implied volatility jumping higher, with our forecast in this scenario being SPX testing 4,400 & VIX 20.
While many of you have noted that our
gamma flip
point is up around 4,550, we’re using 4,500 because its such a large gamma bar. Further, below this level is where positions shift to being predominantly puts (blue bars).
