Macro Theme:
Short Term Resistance: 4,550
Short Term Support: 4,500
Risk Pivot Level: 4,500 – 4,515 (SPY 450)
Major Range High/Resistance: 4,600 – 4,615 (SPY 460/SPX 4,600 Call Wall(s))
Major Range Low/Support: 4,500
‣ The bullish case remains intact with SPX >=4,550 and we hold a current upside target of major 4,600 resistance*
‣ As realized volatility(RV) shifts lower, it suggests implied volatility should grind down, too. With RV at 9, VIX in the 12’s is reasonable*
‣ Risk shifts higher on a break of 4,500, wherein we would look for a test of 4,400 with a VIX shift towards 20*
*updated 8/2
Founder’s Note:
ES futures are down 30bps to 4,525. First resistance is at 4,550 – 4,565 (SPY 455). Major support remains at 4,500, and we see high risk below that level.
The QQQ
Put Wall
has rolled lower, to 370 which is now our support line. Resistance is at 375 & 380.
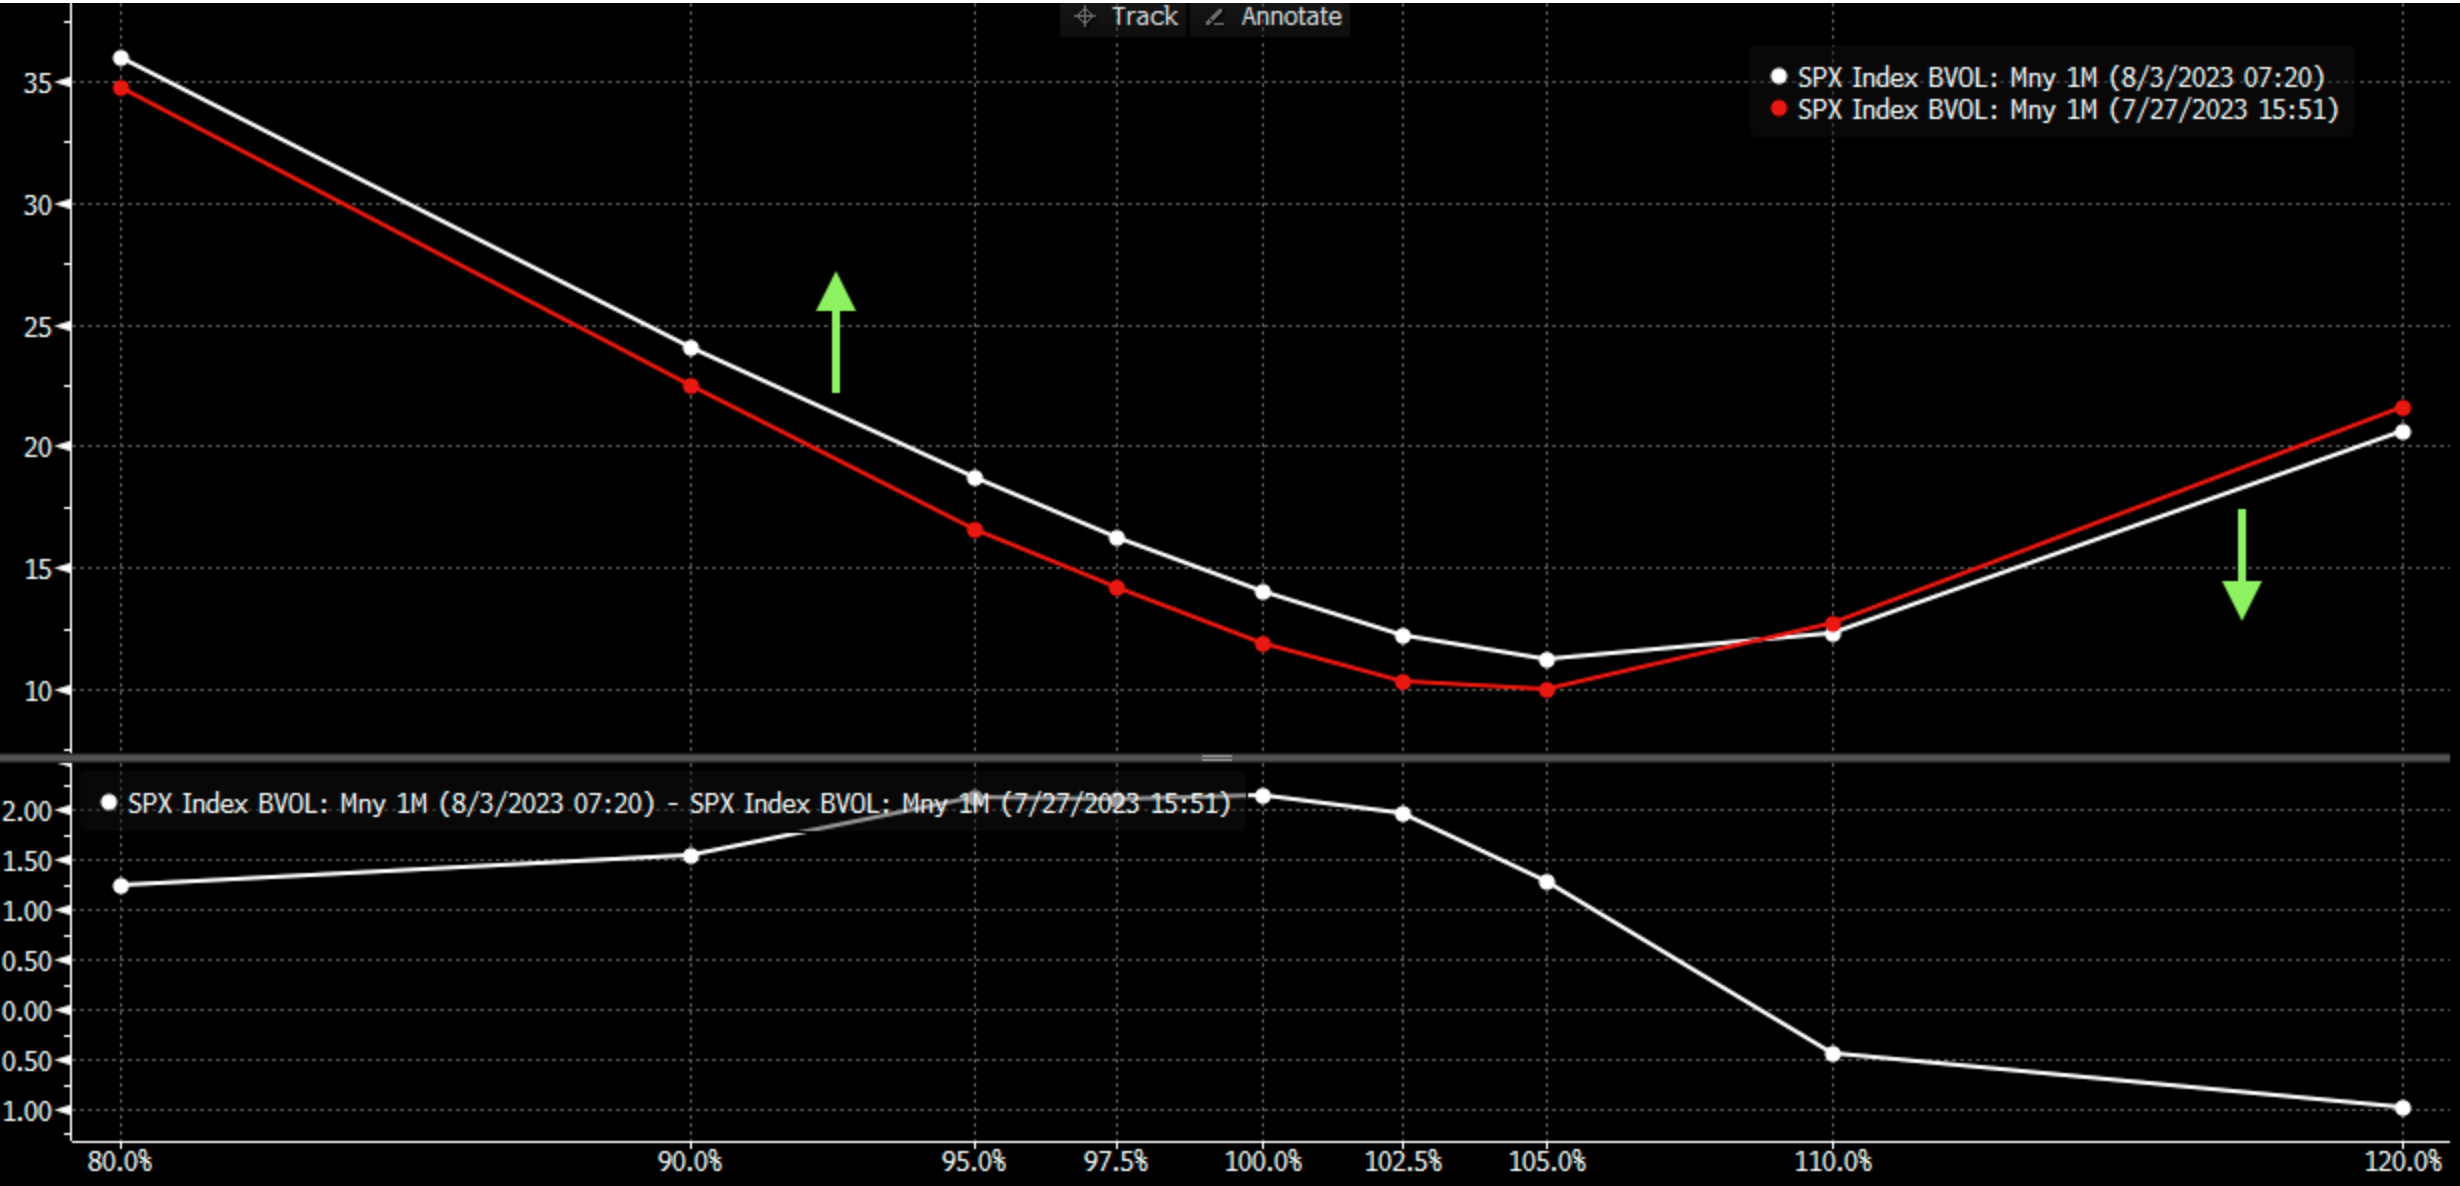
These moments are often those interesting inflection points wherein we think our work begins to forecast movements that deviate sharply from market pricing. To this point, while yesterday certainly put traders on alert, the fear is not translating into demand for short dated long volatility:
- today’s SPX 0DTE ATM straddle is $25/IV of 21.8%
- tomorrows is $41.65 w/IV 18.2%
That’s not to say there was no uptick in volatility, as SPX skew started to twist back in favor of puts (call IV down, put IV up). There was also, unsurprisingly, a big pop in index/equity
put volume
vs
call volume
(chart here).
Our line of demarcation has been 4,500 as this is the gamma
pivot
point. Below this line we think gamma shifts materially negative and that coincides with a substantial pop in implied volatility. However, if we hold this level, then yesterdays bump in IV becomes rather juicy for those vol sellers who’ve been starved of risk premium.
Highlighting this is the chart below, which plots the VIX vs 1 month SPX realized volatility. This shows that traders see more volatility ahead relative to the rather dull markets of the last few weeks.
However if you look back up at those 0DTE straddle prices, its seems that traders aren’t exactly bracing for larger moves ahead.
Quite frankly, its hard to argue with them as the clear trend has been for local pops in IV to get smacked, which has helped to jack equity markets back higher.
However, volatility works both ways. If the SPX can’t be shoved under 4,500, then suddenly that volatility may feel a bit too expensive, and the 0DTE crowd may start buying the dip/selling the IV. This could lead to a rather sharp move higher in the S&P. Plus we have a fair number of catalysts in treasury/bond volatility, non farms (tomorrow), and AAPL/AMZN earnings.
Back to our opening line on “inflection points”, we anticipate a rather large pop in volatility if the S&P breaks 4,500, which invokes a rather quick test of 4,400. We don’t feel that markets effectively price in that reflexive feedback loop of negative gamma <4,500 (per yesterdays note).
In this case we don’t think an upside reaction is fully appreciated, either.
The point here is that we should look for elevated volatility here, and be respectful of the fact that it can express itself in either direction and likely does so in the next 1-2 sessions.
|
SpotGamma Proprietary Levels |
SPX |
SPY |
NDX |
QQQ |
RUT |
IWM |
|---|---|---|---|---|---|---|
|
Reference Price: |
$4513 |
$450 |
$15374 |
$374 |
$1966 |
$195 |
|
SpotGamma Implied 1-Day Move: |
2.31% |
2.31% |
|
|
|
|
|
SpotGamma Implied 5-Day Move: |
2.12% |
|
|
|
|
|
|
SpotGamma Volatility Trigger™: |
$4520 |
$450 |
$15400 |
$377 |
$1950 |
$196 |
|
Absolute Gamma Strike: |
$4500 |
$450 |
$15475 |
$375 |
$1970 |
$190 |
|
SpotGamma Call Wall: |
$4600 |
$460 |
$15475 |
$385 |
$1970 |
$200 |
|
SpotGamma Put Wall: |
$4500 |
$450 |
$15000 |
$370 |
$1800 |
$190 |
|
Additional Key Levels |
SPX |
SPY |
NDX |
QQQ |
RUT |
IWM |
|---|---|---|---|---|---|---|
|
Zero Gamma Level: |
$4521 |
$452 |
$14658 |
$382 |
$1992 |
$198 |
|
Gamma Tilt: |
0.898 |
0.719 |
1.648 |
0.728 |
0.886 |
0.767 |
|
SpotGamma Gamma Index™: |
-0.64 |
-0.36 |
0.060 |
-0.126 |
-0.008 |
-0.036 |
|
Gamma Notional (MM): |
‑$311.289M |
‑$1.362B |
$6.608M |
‑$617.572M |
‑$7.909M |
‑$324.013M |
|
25 Day Risk Reversal: |
-0.047 |
-0.039 |
-0.042 |
-0.038 |
-0.036 |
-0.036 |
|
Call Volume: |
591.007K |
2.192M |
9.707K |
1.246M |
18.821K |
194.949K |
|
Put Volume: |
1.087M |
3.39M |
17.576K |
1.764M |
32.427K |
580.858K |
|
Call Open Interest: |
6.161M |
7.059M |
57.919K |
4.566M |
195.712K |
3.547M |
|
Put Open Interest: |
12.818M |
14.512M |
75.276K |
9.644M |
364.663K |
7.198M |
|
Key Support & Resistance Strikes |
|---|
|
SPX Levels: [4600, 4550, 4500, 4400] |
|
SPY Levels: [455, 452, 450, 445] |
|
NDX Levels: [16000, 15500, 15475, 15000] |
|
QQQ Levels: [380, 377, 375, 370] |
|
SPX Combos: [(4698,82.35), (4613,77.78), (4599,81.07), (4563,77.40), (4549,75.27), (4509,92.07), (4500,79.84), (4482,81.09), (4459,85.78), (4410,78.01)] |
|
SPY Combos: [449.68, 444.73, 468.59, 446.98] |
|
NDX Combos: [15482, 15190, 15282, 15405] |
|
QQQ Combos: [368.77, 376.64, 381.5, 366.9] |
