
Macro Theme:
Short Term Resistance: 4,550
Short Term Support: 4,450
Risk Pivot Level: 4,500 – 4,515 (SPY 450)
Major Range High/Resistance: 4,600 – 4,615 (SPY 460/SPX 4,600 Call Wall(s))
Major Range Low/Support: 4,400
‣ We look for market support in to Wednesday 8/16 VIX Exp, with 4,500-4,550 short term resistance*
‣ A longer term bullish trend initiates with SPX >=4,500 and we hold a current upside target high of 4,600*
‣ Current positioning suggests 4,400 would be a major interim low, with traders likely taking a directional cue Jackson Hole on 8/24-8/26*
‣ <4,400 would be a significant “risk off” as dealer negative gamma increases*
*updated 8/14
Founder’s Note:
Futures are unchanged to 4,475. Key SG levels have spread out some: support is at 4,460 & 4,450. There is no major support level <4,450 to 4,400. Resistance above is at 4,500. Despite the perceived gaps in support and resistance our implied daily move is a low 0.67% (open/close).
In QQQ major support shows at 365, with resistance at 374/375.
We’re watching Wed AM VIX Exp & FOMC mins, followed by Friday’s OPEX.
TLDR: we continue to look for tight ranges, with an equity tail wind to 4,500 in through Wed AM VIX exp. After Wed AM we think volatility could expand some, and that plays into next weeks Jackson Hole.
Our view heading into this week was that the Index weakness was driven by the consolidation/mean reversion in equities. In June & July, we had a situation wherein there was a lot of call froth and major single stock outperformance, and this is/has now burned off. This is uniquely viewed through the COR1M (correlation index) that we discussed on Friday. Rich single stock IV’s are moving back in line with Index IV’s.
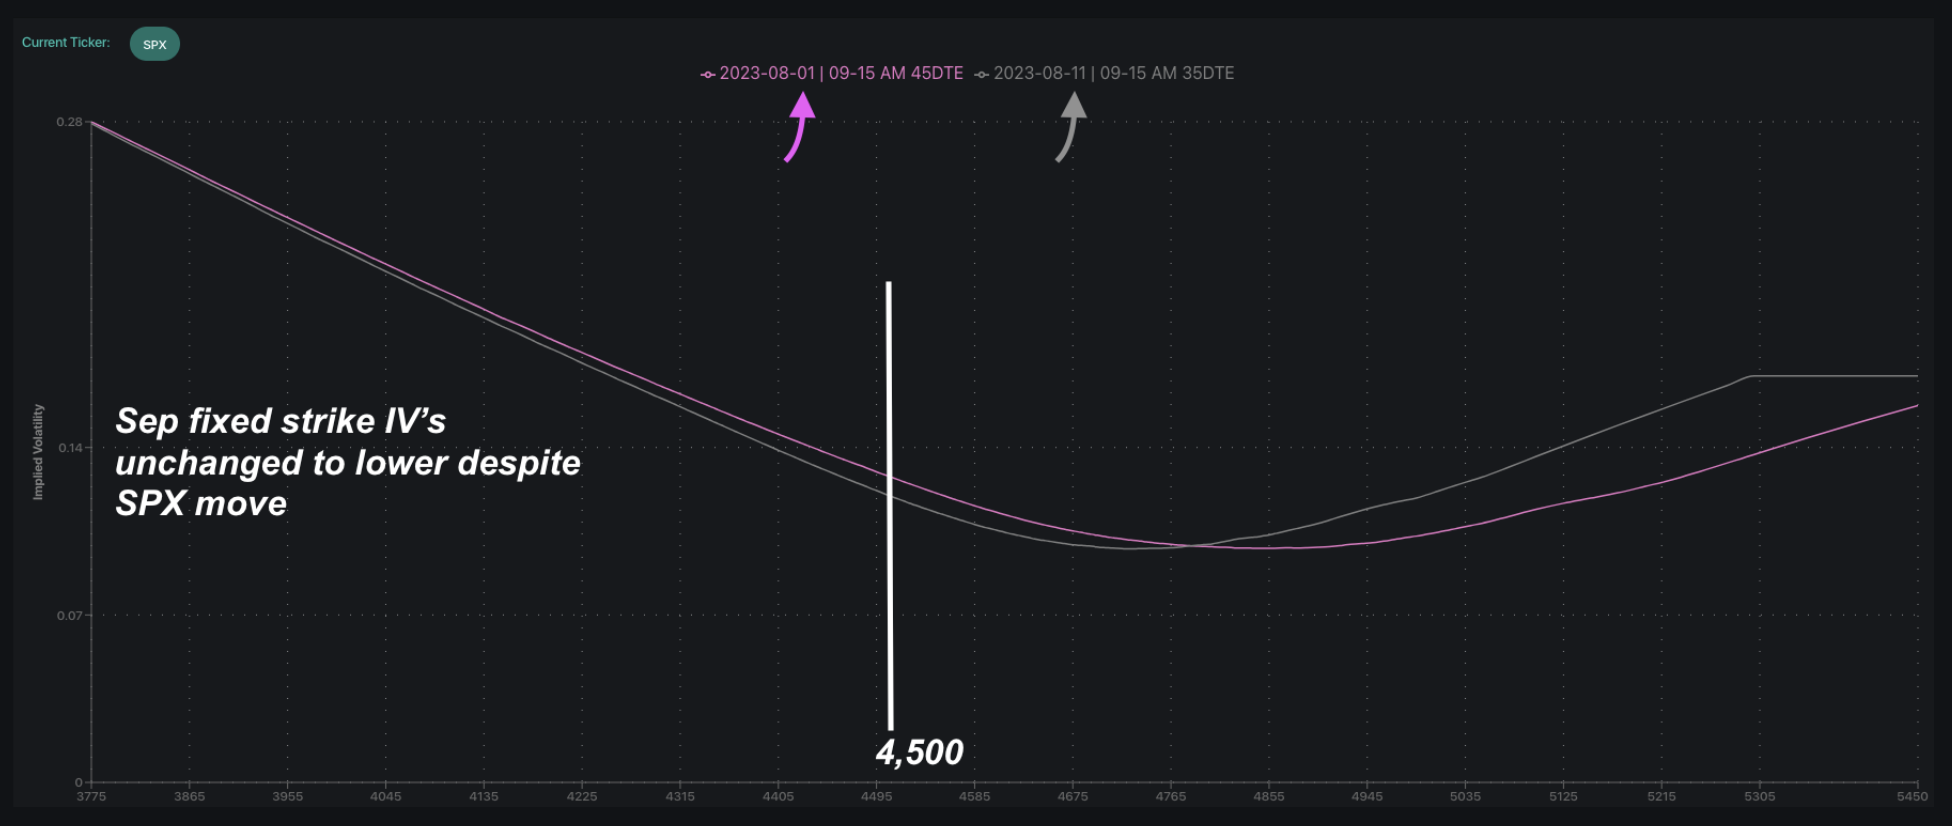
Despite a fair amount of hand-wringing around equity risks, implied volatility is not reacting to lower S&P prices. This can be seen in the fixed strike space, which we’ve plotted below. Over the plotted time frame the SPX is ~3% lower, but IV’s are flat to slightly lower. We just do not see signs of downside hedging. If IV’s do shift higher it is a signal of put buying/downside hedging, and that would suggests risks are rising.
We believe equities will be strongly supported on Monday & Tuesday by Wednesdays VIX expiration. As you can see below there is a fair amount of VIX put open interest <=15, and if the VIX is near this area into Tuesday it may spur flow which seeks to push/pin the VIX lower into Wednesday AM’s print. This is akin to what took place in July wherein the VIX multi-day low was at the 9:30AM VIX expiration, as was the intraday ES high (VIX chart here).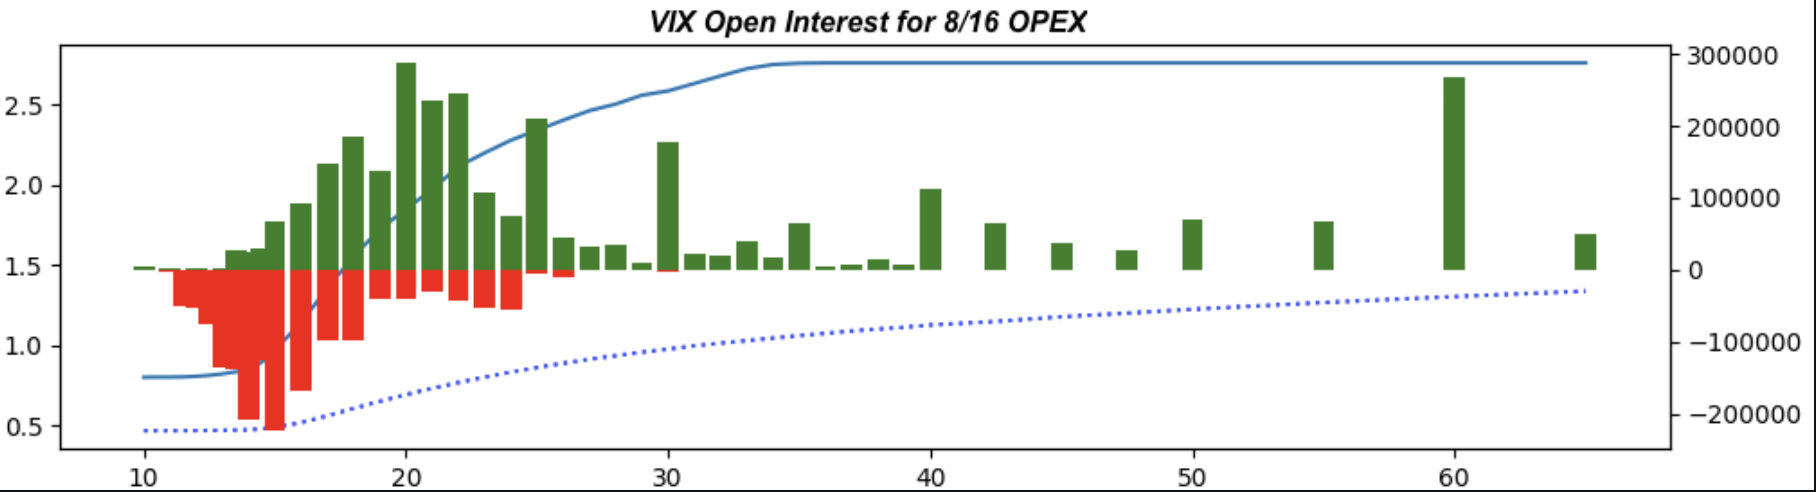
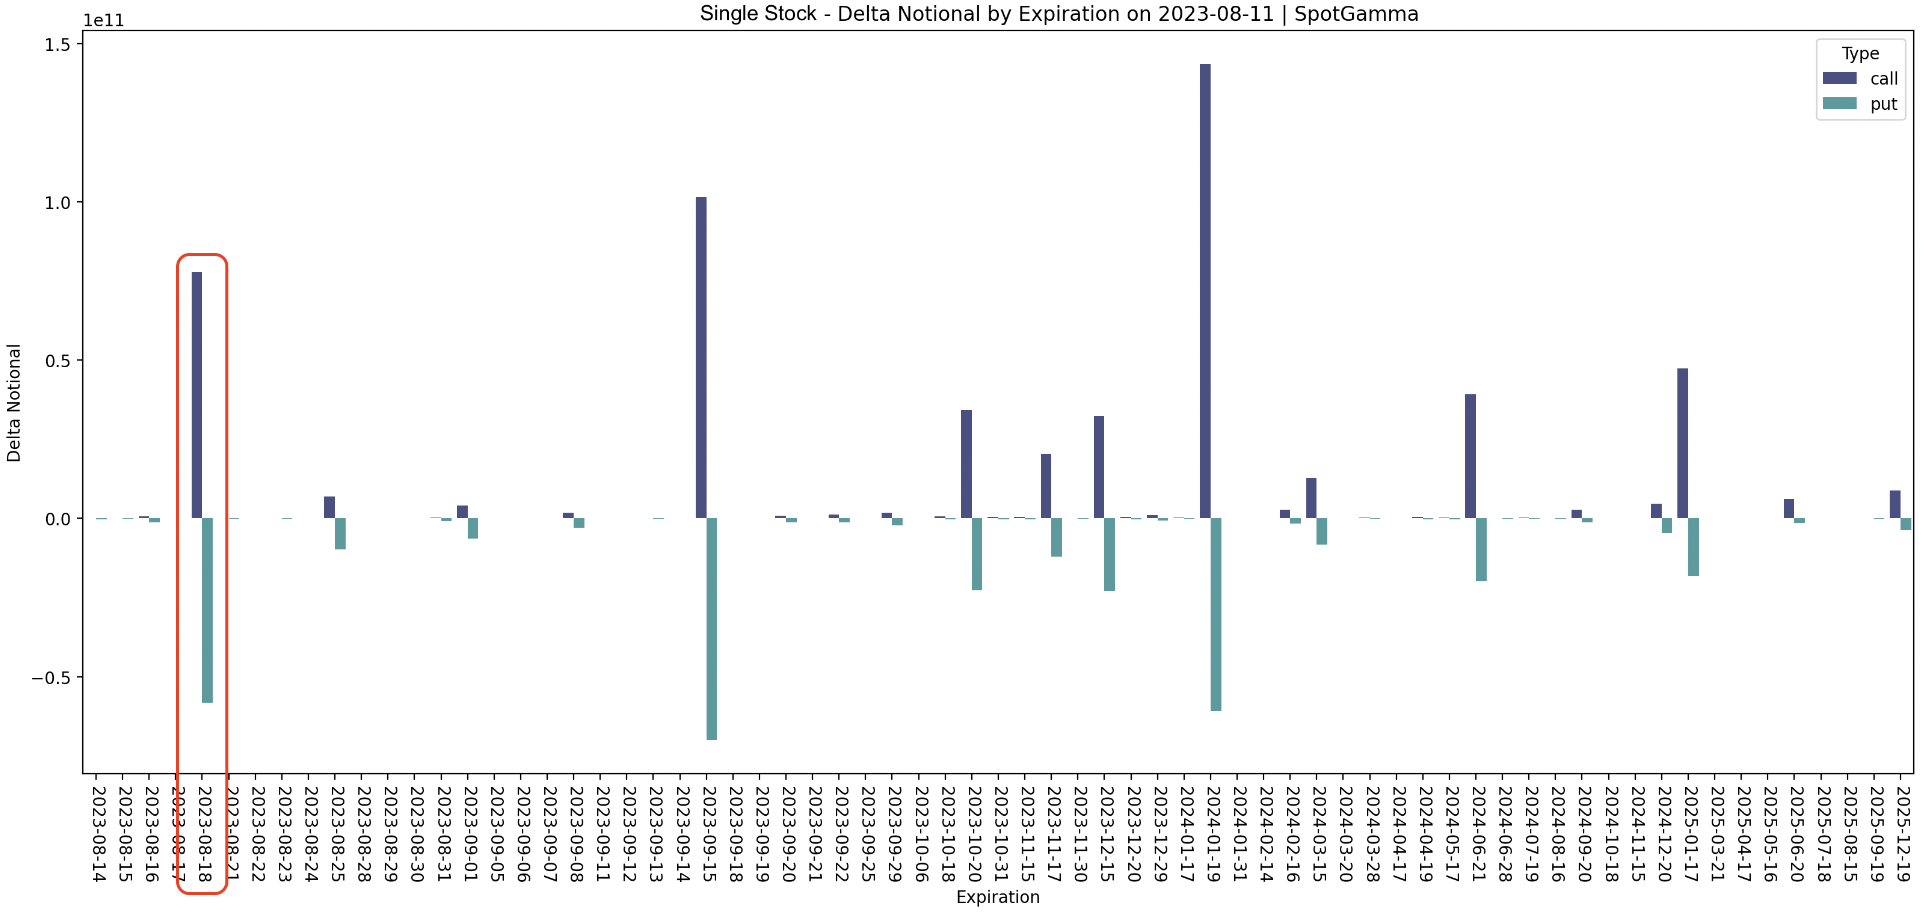
For the SPX & equity options, this is not a particularly significant expiration. It is also balanced between puts (teal) and calls (purple), as shown below for all single stocks. It is a fairly large expiration for SPY & QQQ, and so our read here is that while this expiration doesn’t pose a significant directional lean (due to put/call balance), but it could serve to release volatility. This plays into next weeks Jackson Hole meetings.
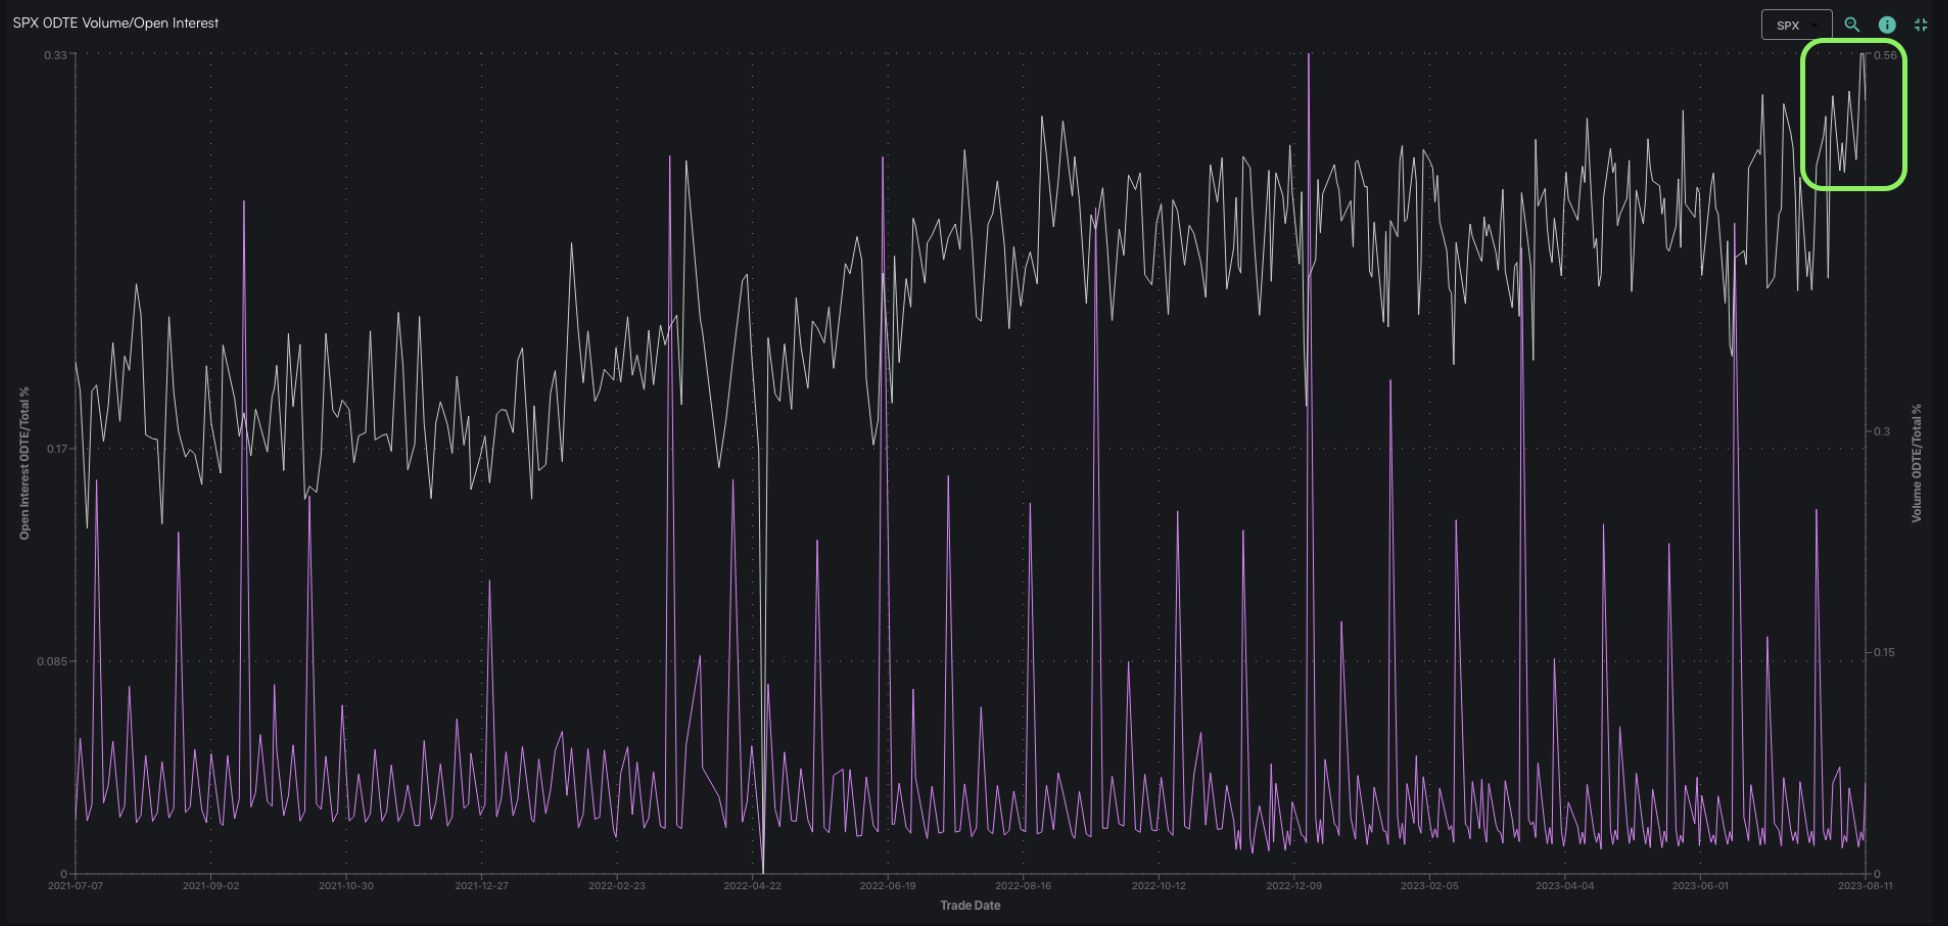
The other factor which is a bit hard to predict is 0DTE. We recently discussed the uniquely elevated levels of 0DTE flow, and the anomaly persists. Last Thursday posted a record 56% of 1 day SPX volume as 0DTE, and we believe these flows whats driving the large daily mean reversion in equities. This is not a function of lower overall SPX volumes, it appears to be a new flow that has “turned on”. While we admittedly do not understand the source of this flow, we theorize it may subside after this weeks VIX & equity OPEX.
| SpotGamma Proprietary Levels | SPX | SPY | NDX | QQQ | RUT | IWM |
|---|---|---|---|---|---|---|
| Reference Price: | $4464 | $445 | $15028 | $366 | $1925 | $190 |
| SpotGamma Implied 1-Day Move: | 0.67% | 0.67% |
|
|
|
|
| SpotGamma Implied 5-Day Move: | 2.12% |
|
|
|
|
|
| SpotGamma Volatility Trigger™: | $4485 | $445 | $15090 | $375 | $1955 | $193 |
| Absolute Gamma Strike: | $4500 | $445 | $15475 | $370 | $1970 | $190 |
| SpotGamma Call Wall: | $4600 | $460 | $15475 | $400 | $1970 | $200 |
| SpotGamma Put Wall: | $4400 | $440 | $15000 | $365 | $1800 | $190 |
| Additional Key Levels | SPX | SPY | NDX | QQQ | RUT | IWM |
|---|---|---|---|---|---|---|
| Zero Gamma Level: | $4471 | $448 | $14877 | $374 | $1964 | $196 |
| Gamma Tilt: | 0.887 | 0.722 | 1.192 | 0.684 | 0.734 | 0.624 |
| SpotGamma Gamma Index™: | -0.768 | -0.334 | 0.025 | -0.152 | -0.027 | -0.071 |
| Gamma Notional (MM): | ‑$506.266M | ‑$1.458B | $3.495M | ‑$810.80M | ‑$26.459M | ‑$695.81M |
| 25 Day Risk Reversal: | -0.048 | -0.049 | -0.043 | -0.044 | -0.036 | -0.036 |
| Call Volume: | 447.491K | 1.865M | 9.678K | 880.807K | 9.691K | 145.873K |
| Put Volume: | 858.135K | 2.323M | 14.248K | 1.163M | 22.884K | 308.554K |
| Call Open Interest: | 6.386M | 7.018M | 62.509K | 4.797M | 208.849K | 3.589M |
| Put Open Interest: | 13.17M | 14.681M | 83.274K | 9.897M | 393.758K | 7.429M |
| Key Support & Resistance Strikes |
|---|
| SPX Levels: [4550, 4500, 4450, 4400] |
| SPY Levels: [450, 446, 445, 440] |
| NDX Levels: [15500, 15475, 15000, 14000] |
| QQQ Levels: [375, 370, 365, 360] |
| SPX Combos: [(4665,88.61), (4652,92.95), (4625,85.36), (4607,74.90), (4598,96.52), (4576,88.78), (4558,85.85), (4549,93.85), (4544,75.89), (4531,75.27), (4527,94.00), (4522,75.30), (4509,79.51), (4469,94.10), (4460,91.90), (4455,92.36), (4451,92.86), (4446,74.86), (4442,76.97), (4428,91.35), (4424,91.09), (4419,77.01), (4410,76.60), (4406,90.23), (4402,97.79), (4397,74.81), (4379,78.22), (4375,85.38), (4357,80.27), (4348,96.19), (4339,76.79), (4326,77.49), (4308,83.67), (4299,97.31), (4259,74.65), (4250,88.61)] |
| SPY Combos: [438.92, 443.82, 428.67, 433.57] |
| NDX Combos: [15479, 14983, 14773, 14367] |
| QQQ Combos: [374.64, 362.56, 364.76, 367.68] |
0 comentarios