Macro Theme:
Short Term SPX Resistance: 4,160 (SPY 415)
Short Term SPX Support: 4,100
SPX Risk Pivot Level: 4,220
Major SPX Range High/Resistance: 4,300
Major SPX Range Low/Support: 4,100
‣ Nov 1st FOMC is a major turning point for equities*
‣ We view 4,000 as a major support level for the S&P500*
*updated 10/30
Founder’s Note:
ES Futures are 60bps higher to 4,163. Key SG levels for the SPX are:
- Support: 4,115, 4,100
- Resistance: 4,150 4,165
- 1 Day Implied Range: 0.85%
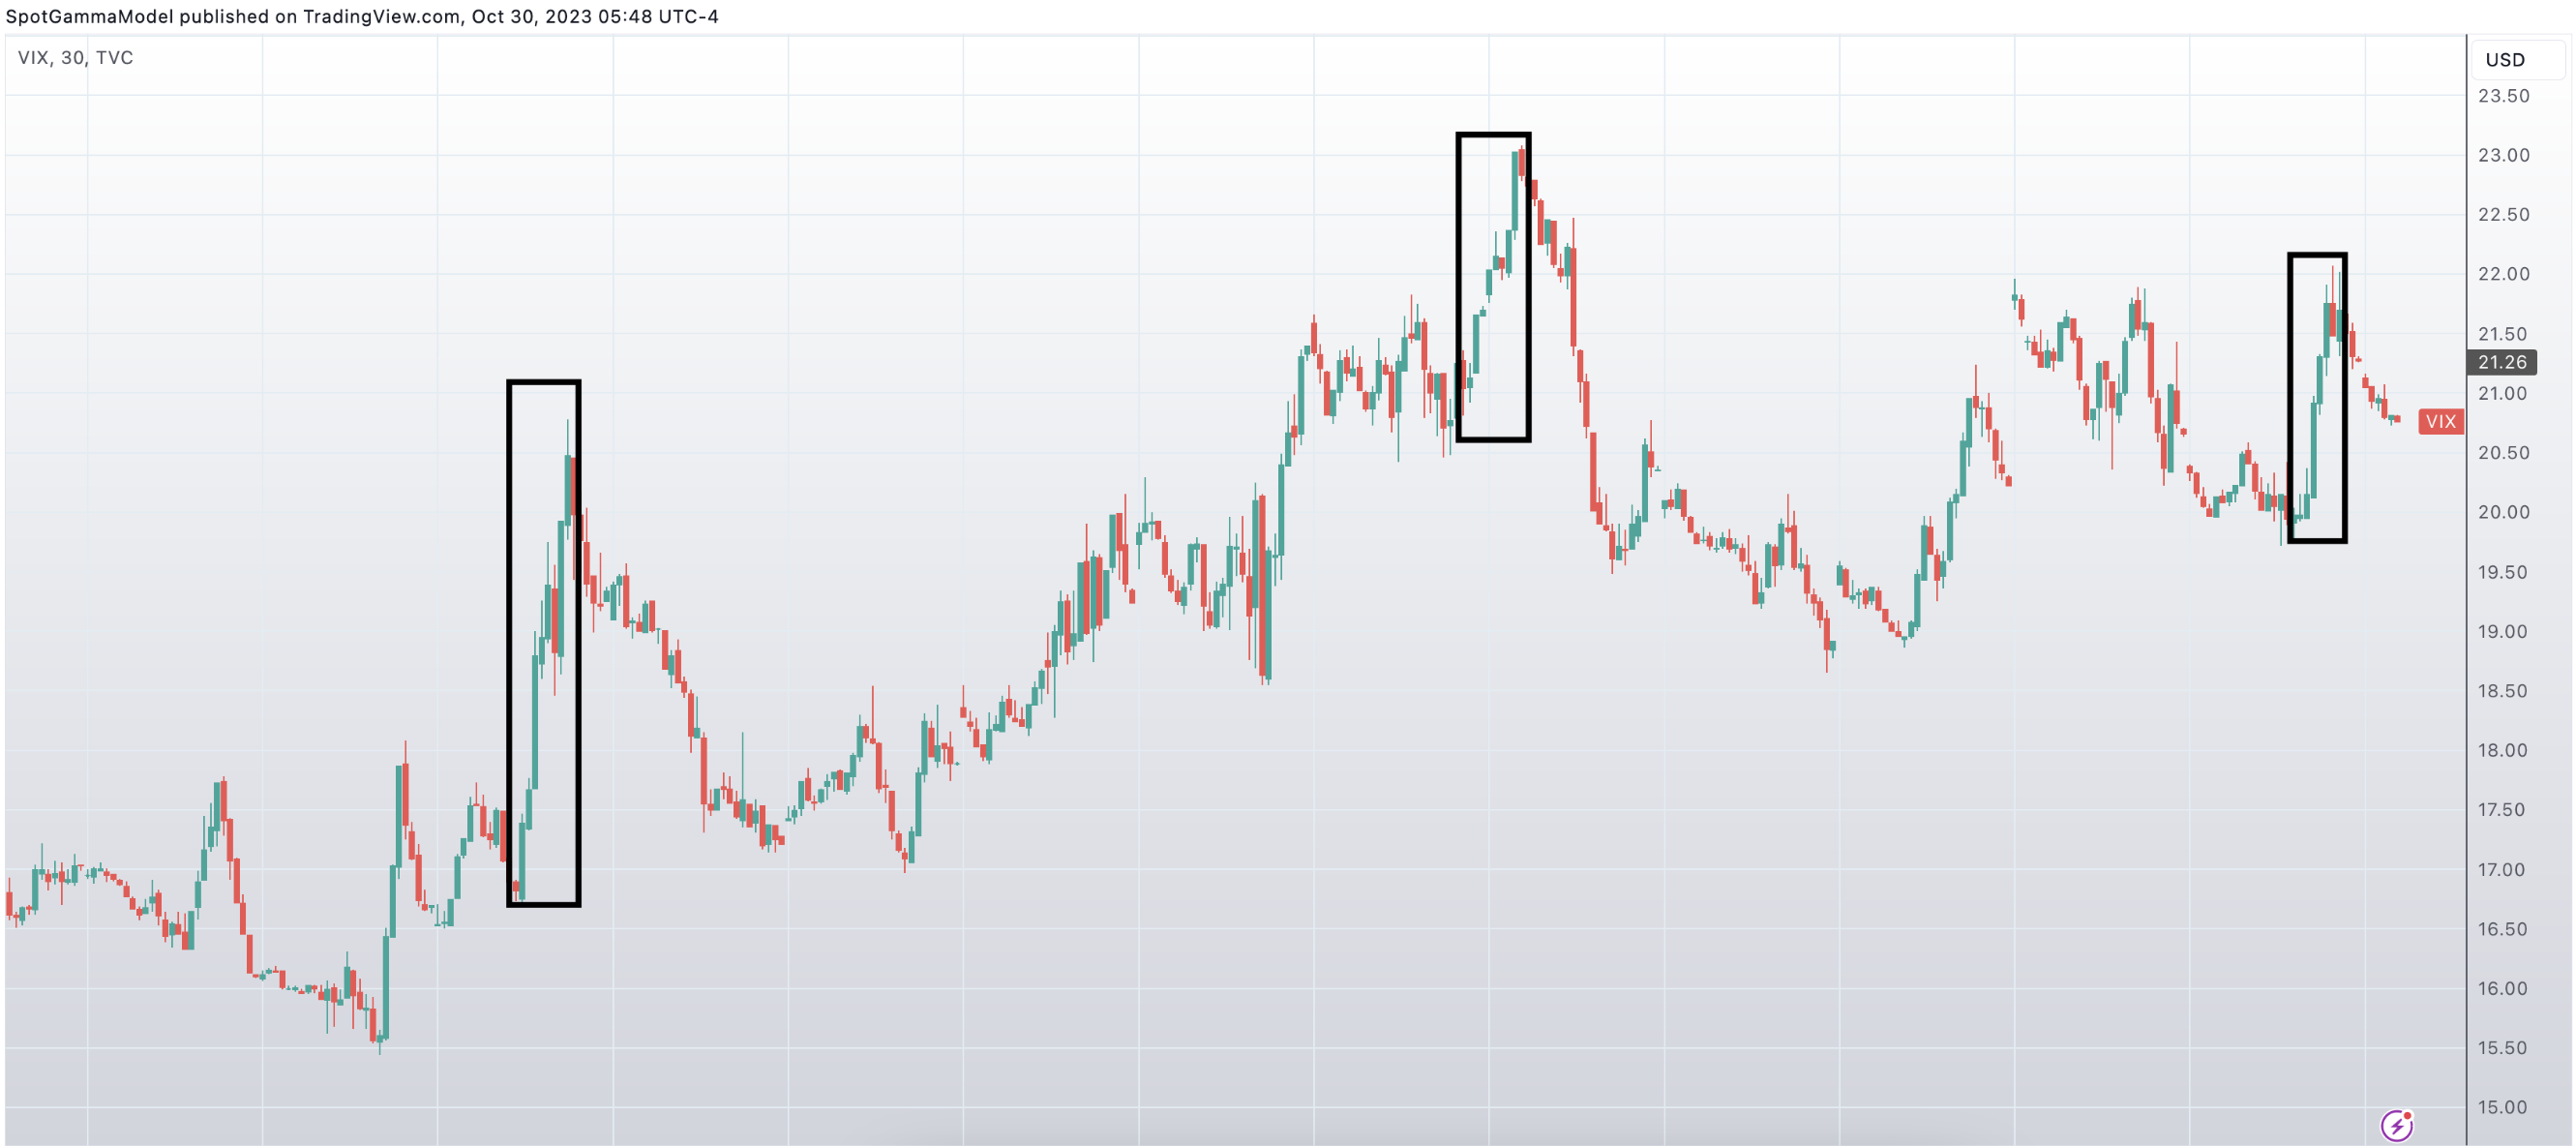
The VIX, at 20.7, is pulling back from Friday’s highs near 22. There has been a trend of VIX/vol being bid into Friday due to weekend risk, and then finding relief on Monday. Lower VIX/IV then helps to stabilize equities on Monday. We anticipate this to be the case today, with SPX holding above the SPX 4100 Put Wall.
We view 4,150 – 4,165 as a resistance band for today, and think that a full break higher over that level is unlikely as VIX/IV cannot “fully release” until the 11/1 FOMC.
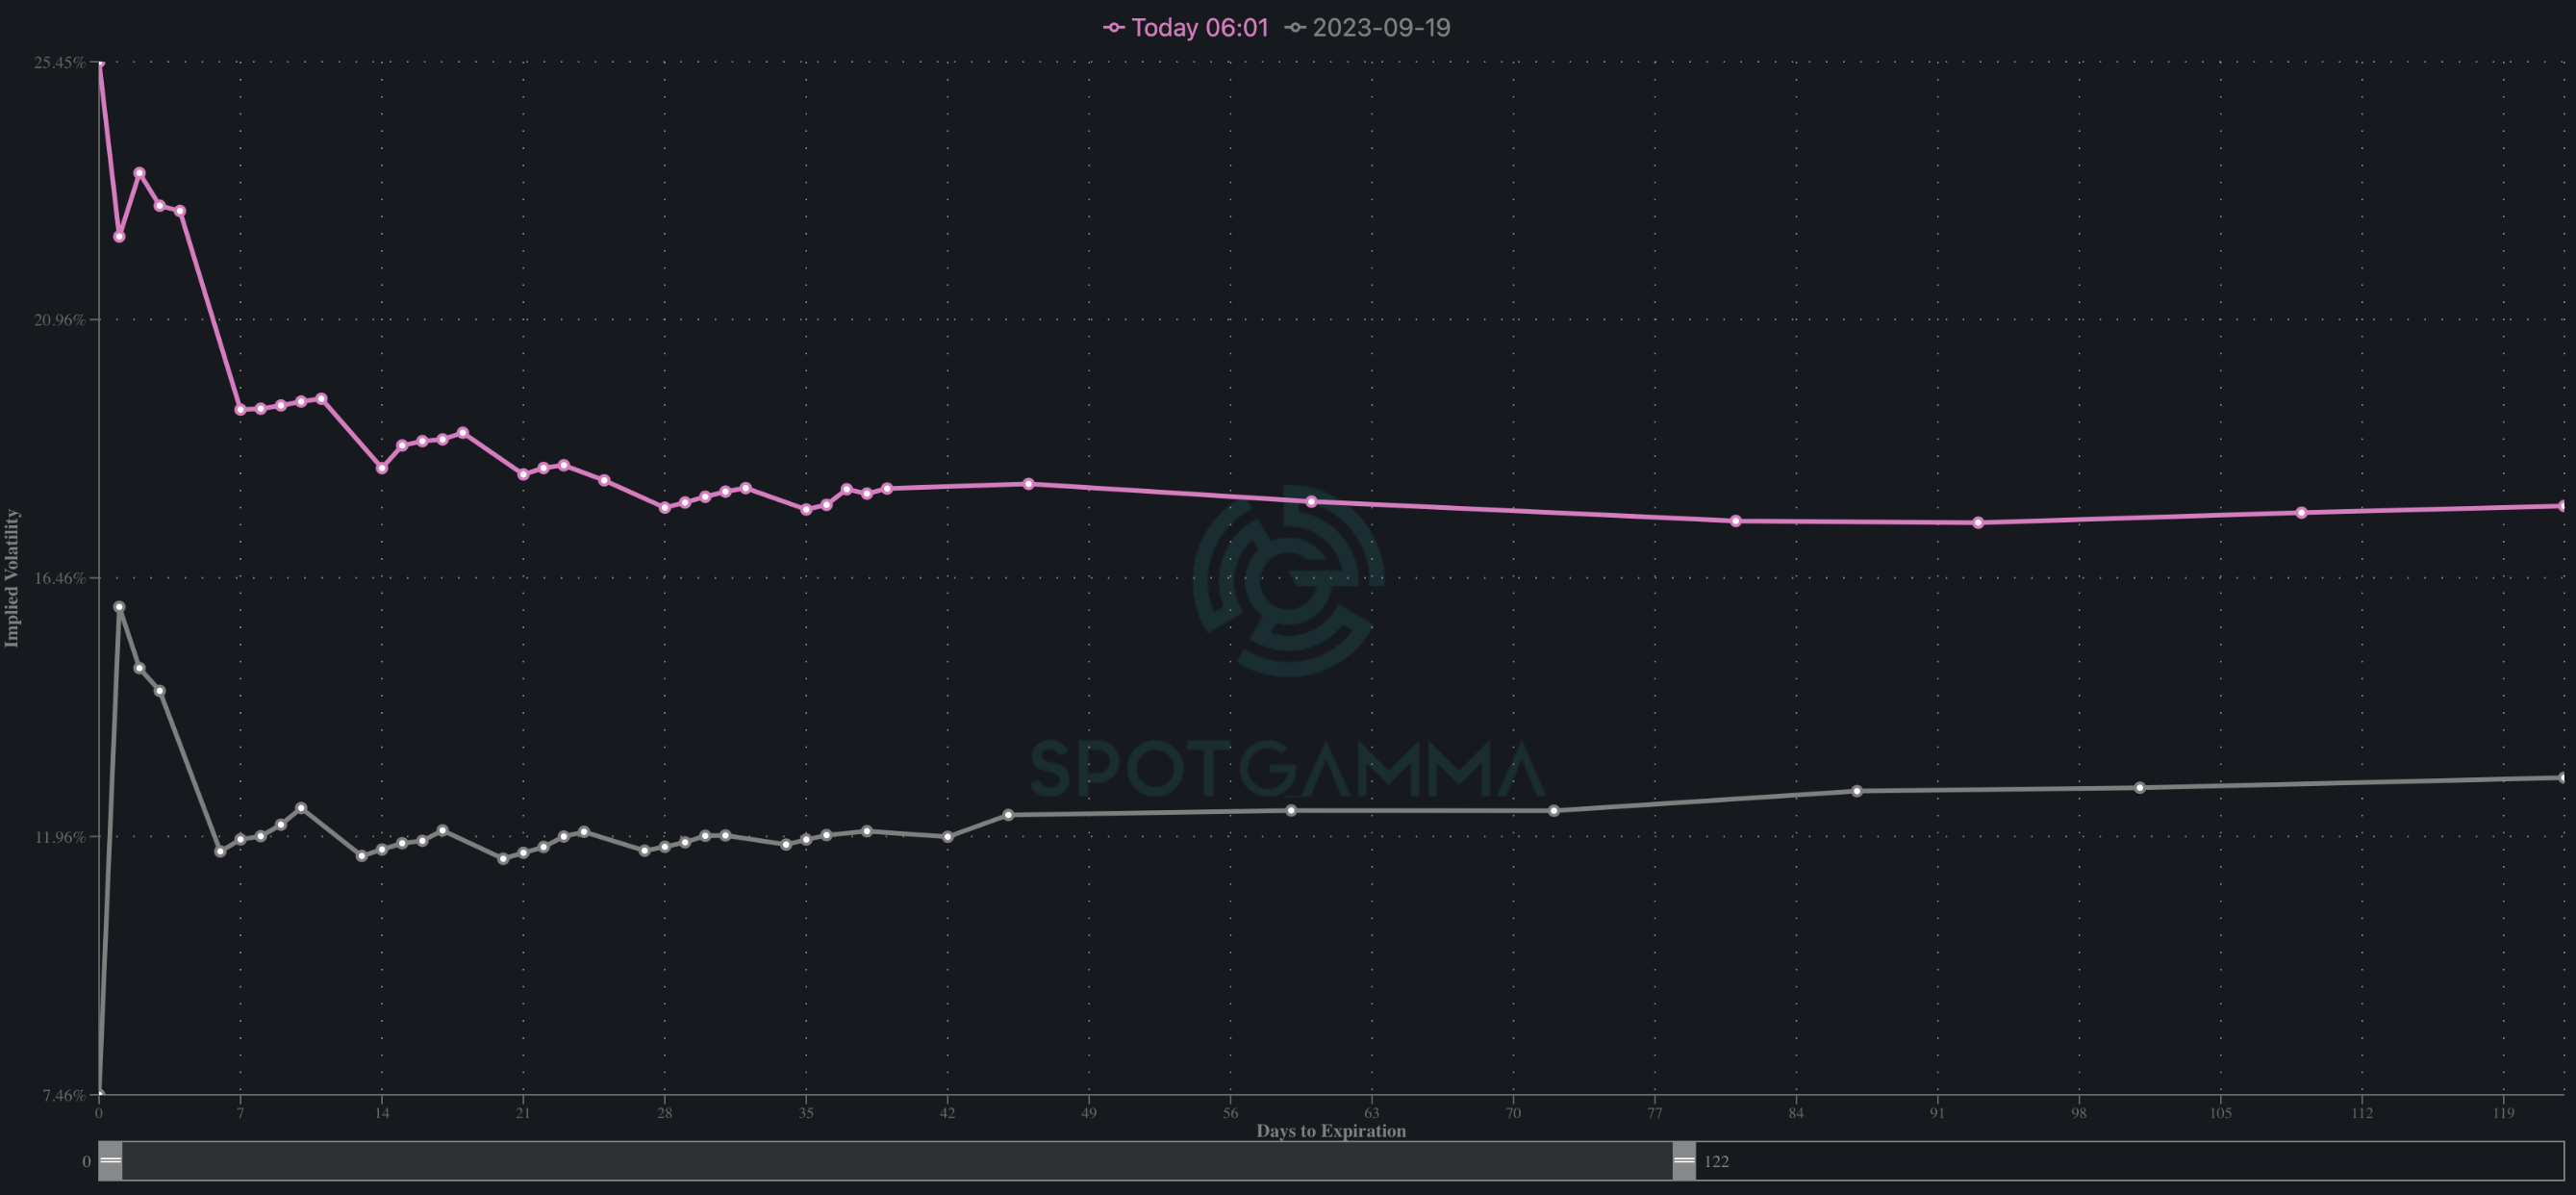
There remains a fairly significant bid in IV as we head into Wednesday FOMC. Shown below is the current SPX term structure (pink) vs that of the previous FOMC (gray). This term structure reflects at-the-money IV’s for each expiration, and as you can see current IV’s are sharply higher than into Sep FOMC. The first order implication of this is that traders are anticipating more movement out of this FOMC. The first order effect of this elevated IV is hedging flows, aka vanna, which will “release” on Wednesday, and likely drive a sharp directional change into Nov OPEX.
Heading into last week, our view was that the S&P would maintain the 4,200 – 4,300 area into this week, with 4,000 being a major, long term support level. The thrashing of the Magnificent 7 into earnings (ex: MGK Mag 7 ETF -2.25% on the week) instead shifted the effective range down to 4,100 – 4,200.
While the current SPX trading range has shifted lower, our view that 4,000 as material support has not changed. To the upside a close >= 4,200 is a bullish trigger. The bullishness would be fueled by IV reversion/short covering.
To break <4,000 into Nov OPEX we think Powell would have to be overtly hawkish. This is because there is very large interest at 4,000, which syncs with levels we’d consider “oversold”. These factors combine to signal equity support.
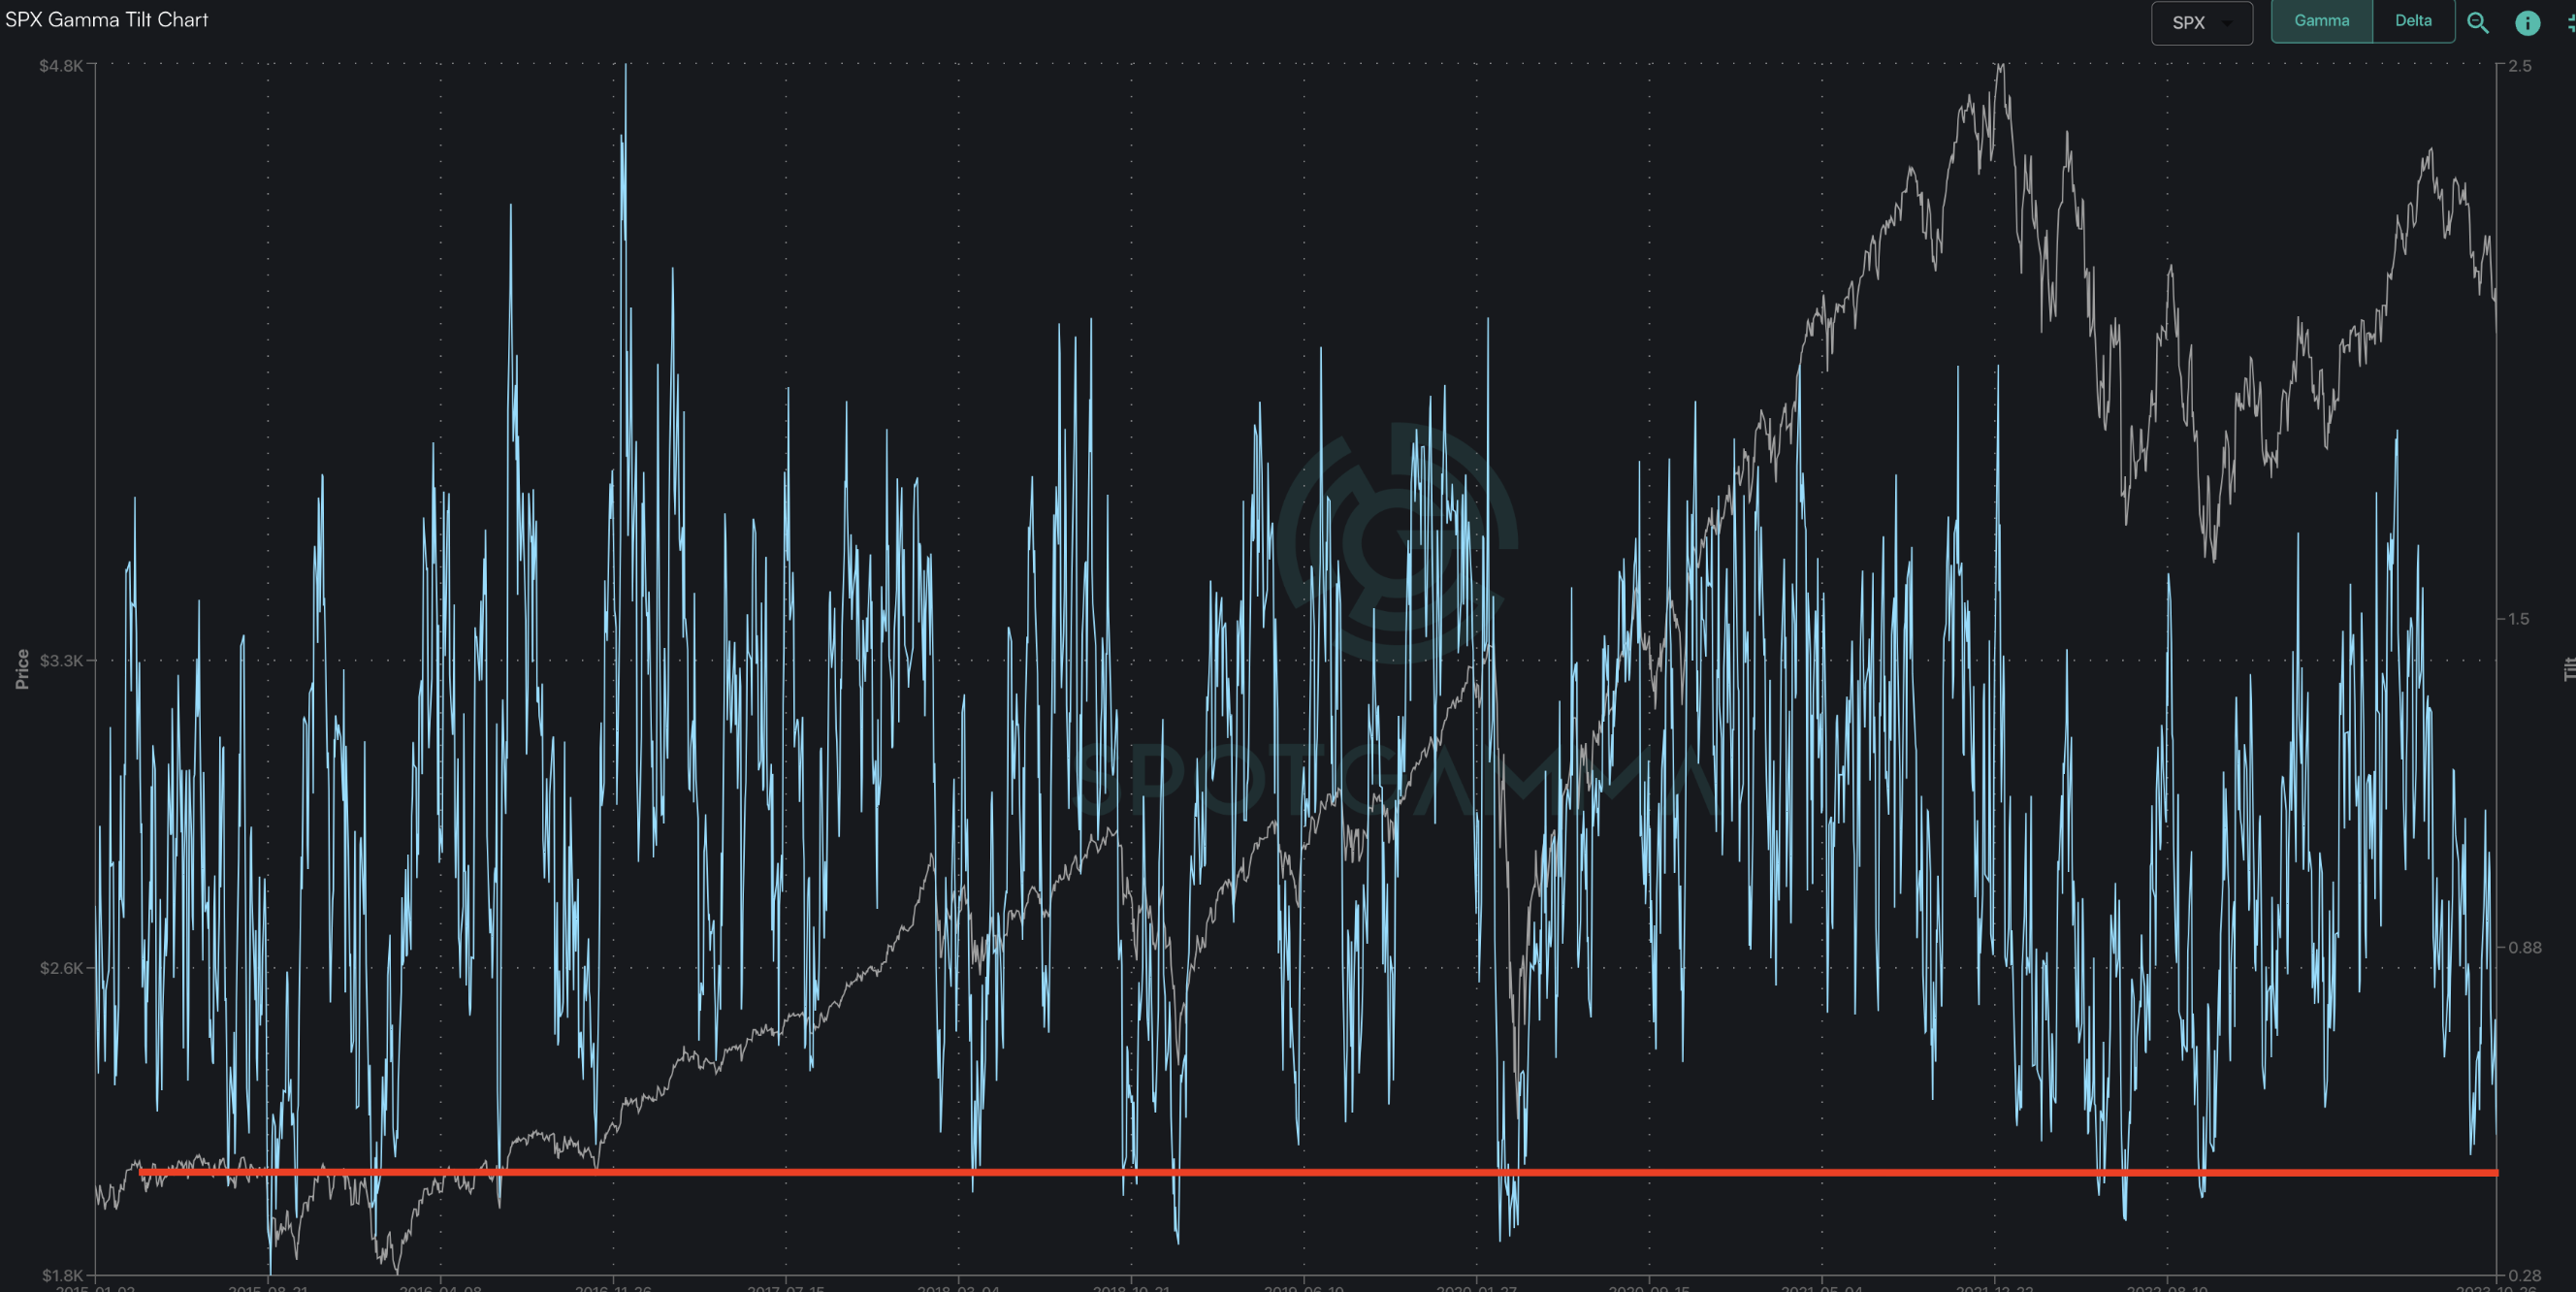
One example to back this idea is our Gamma Tilt metric, which measures total
put gamma
vs total
call gamma.
In put-heavy environments this indicator will stretch lower, as it is doing today. We view this as a way of saying that put positioning is at extremes vs calls, and that has implications not just from a sentiment perspective, but also from a dealer positioning perspective. We’d argue that if dealer inventory is dominated by puts, the pricing of put options may increase, which disincentivizes incremental put purchasing.
Should the SPX drive down near 4,000 this metric will likely hit lows that have been associated with major lows in the past like March ’20 & June ’22. This should not be framed as an expectation that we’d see “the” equity bottom, but a situation in which a sharp short covering rally driven by the closure/rolling of put positions. The VIX would also move to levels which confirms extreme put pricing.
We’d further argue that both bulls and bears may want to see a rally here. For bulls, the reasons are obvious as higher prices benefit their positions. For bears, the benefit of a rally is that the clearing of put positions with a rally would remove/weaken the positions that supported the market. This would clear the way for lower lows into year end.
We wanted to close with a quite note on our levels. Many of you, particularly our long term Memebers, have noted strange relationships in our levels the past few days. For example, we today see the Vol Trigger at 429 for SPY, but the SPY
Call Wall
is at 414. Its very rare to see the
Call Wall
< Vol Trigger. For SPY this is happening because of the put-heavy environment we are in –
Call Wall
s are flickering due to traders coming in and placing very short term bets around FOMC. Therefore these somewhat unusual SG levels are not an error in data, but a reflection of trader positioning.
| SpotGamma Proprietary Levels | SPX | SPY | NDX | QQQ | RUT | IWM |
|---|---|---|---|---|---|---|
| Reference Price: | $4117 | $410 | $14381 | $345 | $1636 | $162 |
| SpotGamma Implied 1-Day Move: | 0.85% | 0.85% |
|
|
|
|
| SpotGamma Implied 5-Day Move: | 2.39% |
|
|
|
|
|
| SpotGamma Volatility Trigger™: | $4300 | $429 | $14475 | $355 | $1750 | $180 |
| Absolute Gamma Strike: | $4000 | $410 | $14600 | $350 | $1700 | $165 |
| SpotGamma Call Wall: | $4600 | $414 | $14600 | $380 | $1690 | $190 |
| SpotGamma Put Wall: | $4100 | $410 | $14000 | $345 | $1600 | $160 |
| Additional Key Levels | SPX | SPY | NDX | QQQ | RUT | IWM |
|---|---|---|---|---|---|---|
| Zero Gamma Level: | $4282 | $425 | $14345 | $358 | $1801 | $178 |
| Gamma Tilt: | 0.561 | 0.451 | 0.995 | 0.529 | 0.504 | 0.323 |
| SpotGamma Gamma Index™: | -2.655 | -0.53 | -0.001 | -0.197 | -0.035 | -0.126 |
| Gamma Notional (MM): | ‑$1.347B | ‑$2.471B | ‑$131.855K | ‑$1.077B | ‑$40.10M | ‑$1.517B |
| 25 Day Risk Reversal: | -0.06 | -0.05 | -0.056 | -0.05 | -0.045 | -0.047 |
| Call Volume: | 669.414K | 2.259M | 8.516K | 1.003M | 24.579K | 446.296K |
| Put Volume: | 1.332M | 3.52M | 11.33K | 1.237M | 44.391K | 1.433M |
| Call Open Interest: | 6.785M | 7.348M | 52.813K | 4.726M | 235.577K | 3.877M |
| Put Open Interest: | 12.496M | 11.542M | 66.879K | 7.985M | 393.847K | 7.136M |
| Key Support & Resistance Strikes |
|---|
| SPX Levels: [4300, 4200, 4100, 4000] |
| SPY Levels: [420, 415, 410, 400] |
| NDX Levels: [15500, 15000, 14600, 14500] |
| QQQ Levels: [360, 350, 345, 340] |
| SPX Combos: [(4249,86.51), (4200,97.67), (4150,95.41), (4138,85.33), (4130,73.25), (4126,89.20), (4121,76.29), (4109,94.50), (4101,99.46), (4089,80.79), (4080,83.15), (4076,90.61), (4068,73.71), (4060,93.18), (4056,85.42), (4051,98.70), (4039,80.40), (4031,77.08), (4027,86.38), (4019,73.53), (4010,92.19), (3998,98.30), (3973,73.29), (3961,72.28), (3949,94.79), (3924,78.09)] |
| SPY Combos: [409.04, 404.11, 398.77, 418.89] |
| NDX Combos: [14367, 14166, 14597, 13965] |
| QQQ Combos: [343.62, 338.81, 349.12, 333.99] |
0 comentarios