Macro Theme:
Short Term SPX Resistance: 4,700
Short Term SPX Support: 4,600
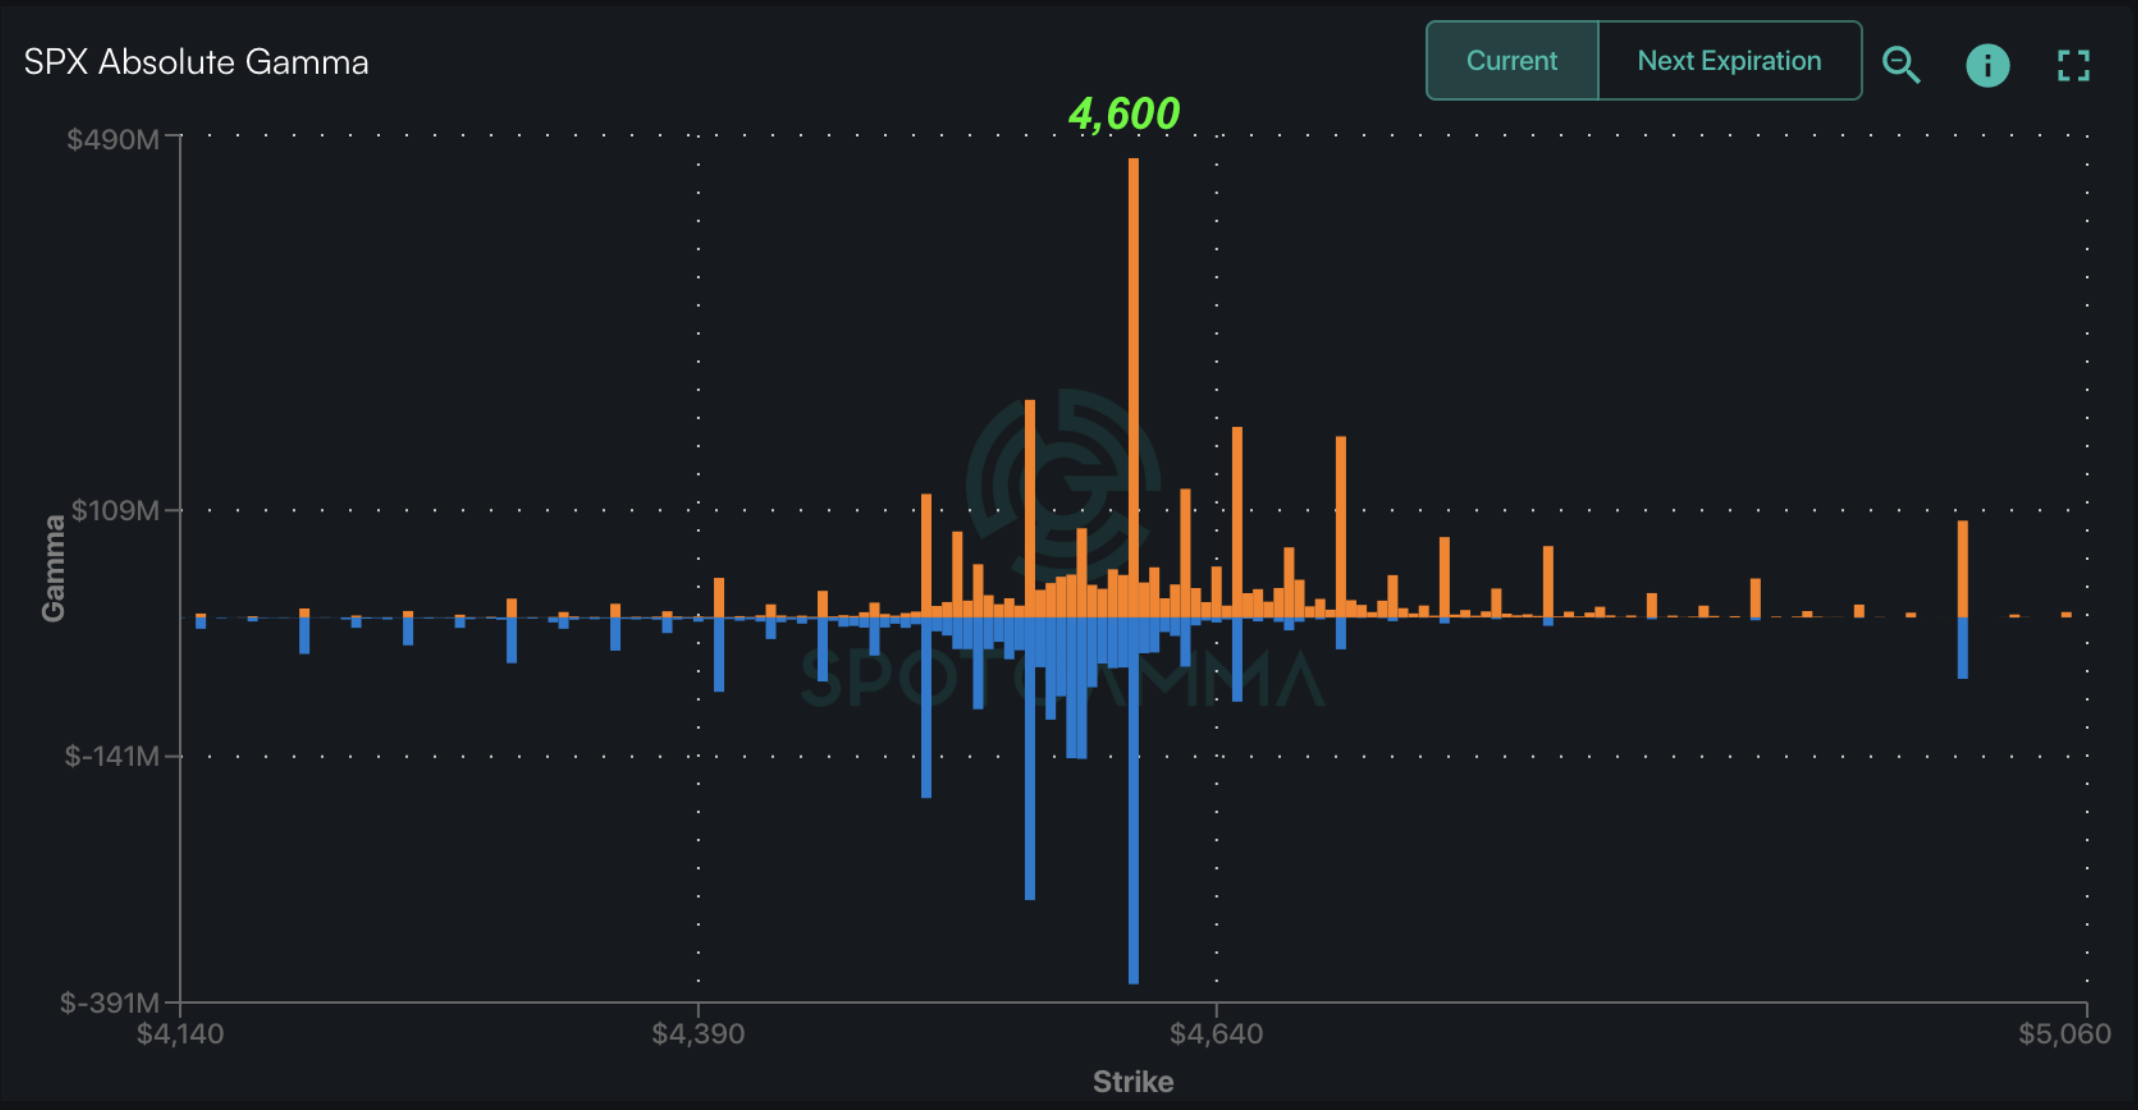
SPX Risk Pivot Level: 4,600
Major SPX Range High/Resistance: 4,700
Major SPX Range Low/Support: 4,400
‣ We look for higher volatility this week (12/11), triggered by 12/12 CPI, 12/13 FOMC and into the huge 12/15 OPEX.*
‣ 4,700 is our current max upside target, due to a Call Wall shift on 12/12. Call Walls in QQQ/IWM are at 400/190.*
‣A break of 4,600 is our “risk off” level.*
‣ January OPEX is setting up to be a major event, with a risk that expiring large long call positions could pull markets lower into mid-January.*
*updated 12/12
Founder’s Note:
ES Futures are up 5 pts to 4,703. Key SG levels for the SPX are:
- Support: 4,625, 4,600, 4,550
- Resistance: 4,650, 4,676, 4,700
- 1 Day Implied Range: 0.85%
Today is FOMC, at 2pm ET.
QQQ support: 393 & 390. Resistance: 400
IWM support: 185 & 180. Resistance: 190
Call Wall
resistance is unchanged across all indices: 465 SPY, 4,700 SPX, 400 QQQ & 190 IWM.
Yesterday AM we discussed the huge call buying in the S&P500, both during the Monday session, but also pre-market. That flow continued throughout the Tuesday session, nearly doubling Monday’s flow toward a massive
HIRO
reading of +$9bn. We believe that to be the largest ever
HIRO
reading. Just as with Monday’s flow, yesterday’s call buying activity was a persistent throughout, suggesting some type of algorithmic hedging. Additionally, over 70% was 0DTE.
This marks a two-day window of S&P500 call buying that was rather extraordinary, given the size, heavy allocation to 0DTE, and uniformity. Our analysis shows that the most consistent flow was purchasing of small lots of at-the-money calls. We also noticed the selling of teeny nickel puts throughout the session, which has a smaller delta/
HIRO
impact, but seemed unusual. We do not have a great idea of what type of entity this is, but the fact that it was so continuous suggests hedging activity, possibly of some year-end position roll.
Some discussion in our Discord circled around the surprise that such massive call buying in the S&P only resulted in an open to close move of 55bps. We’d offer that this flow was up against a tremendous amount of positive gamma, which serves to sell into market strength. With that, our 1-day implied move yesterday was 59bps. If that large, positive dealer gamma was not in place we think the rally would have been sharper.
Today’s FOMC butts up against this positive gamma, too. Our current 1-day implied move is still tight, at 63bps. The market is pricing a very tight move, too, with today’s ATM straddle being only $25.5/54bps (ref: 4,650, IV 21%). This is leaving very little room for error and plays sharply into our idea of “terminal volatility”. Options prices are set for perfection, with very little error. With traders pricing in no risk/movement, just a small amount of surprise could lead to a jump in volatility, and that would play into large positions shifts due to the huge 12/15 OPEX.
As the
Call Walls
did not change from yesterday, our map from yesterday AM remains in play. 4,700 is major resistance, but we do think traders need to be conscious of a sharp reversal here as bullish spirits have left a soft underbelly to this market. A break of 4,600 is considered risk off.
|
SpotGamma Proprietary Levels |
SPX |
SPY |
NDX |
QQQ |
RUT |
IWM |
|---|---|---|---|---|---|---|
|
Reference Price: |
$4643 |
$464 |
$16354 |
$398 |
$1881 |
$187 |
|
SpotGamma Implied 1-Day Move: |
0.63% |
0.63% |
|
|
|
|
|
SpotGamma Implied 5-Day Move: |
1.86% |
|
|
|
|
|
|
SpotGamma Volatility Trigger™: |
$4585 |
$459 |
$14650 |
$393 |
$1700 |
$180 |
|
Absolute Gamma Strike: |
$4600 |
$460 |
$16000 |
$400 |
$1900 |
$185 |
|
SpotGamma Call Wall: |
$4700 |
$465 |
$15825 |
$400 |
$1880 |
$190 |
|
SpotGamma Put Wall: |
$4400 |
$450 |
$14000 |
$360 |
$1700 |
$170 |
|
Additional Key Levels |
SPX |
SPY |
NDX |
QQQ |
RUT |
IWM |
|---|---|---|---|---|---|---|
|
Zero Gamma Level: |
$4547 |
$459 |
$15475 |
$392 |
$1835 |
$180 |
|
Gamma Tilt: |
1.591 |
1.434 |
2.595 |
1.56 |
1.40 |
1.984 |
|
SpotGamma Gamma Index™: |
3.158 |
0.350 |
0.156 |
0.168 |
0.039 |
0.141 |
|
Gamma Notional (MM): |
$1.365B |
$1.35B |
$18.253M |
$746.017M |
$37.591M |
$1.452B |
|
25 Day Risk Reversal: |
-0.02 |
-0.016 |
-0.011 |
-0.012 |
0.010 |
-0.001 |
|
Call Volume: |
608.686K |
1.559M |
16.085K |
720.415K |
22.74K |
508.06K |
|
Put Volume: |
1.144M |
2.024M |
22.423K |
1.014M |
36.247K |
430.524K |
|
Call Open Interest: |
7.98M |
8.057M |
66.509K |
4.714M |
320.134K |
5.804M |
|
Put Open Interest: |
14.402M |
14.824M |
81.143K |
8.722M |
488.161K |
8.60M |
|
Key Support & Resistance Strikes |
|---|
|
SPX Levels: [4700, 4650, 4600, 4550] |
|
SPY Levels: [470, 465, 462, 460] |
|
NDX Levels: [16500, 16200, 16000, 15825] |
|
QQQ Levels: [400, 397, 395, 390] |
|
SPX Combos: [(4848,88.44), (4802,98.70), (4774,90.36), (4751,99.18), (4741,81.88), (4732,79.60), (4727,95.43), (4723,74.77), (4718,87.23), (4713,78.69), (4709,84.17), (4704,96.46), (4699,99.92), (4695,93.25), (4690,90.38), (4685,84.88), (4681,97.57), (4676,98.72), (4672,96.17), (4667,88.28), (4662,98.23), (4653,98.01), (4648,99.72), (4644,88.08), (4639,97.59), (4634,76.24), (4630,84.75), (4625,98.83), (4620,81.89), (4602,99.27), (4579,75.92), (4574,82.76), (4523,75.64), (4514,93.77), (4500,87.41), (4477,74.77), (4449,88.47)] |
|
SPY Combos: [471.78, 461.57, 466.67, 458.79] |
|
NDX Combos: [16403, 15831, 16616, 16207] |
|
QQQ Combos: [402.42, 388.49, 397.64, 407.59] |
SPX Gamma Model
View All Indices Charts

0 comentarios