Macro Theme:
Short Term SPX Resistance: 5,050
Short Term SPX Support: 5,000
SPX Risk Pivot Level: 4,900
Major SPX Range High/Resistance: 5,100
Major SPX Range Low/Support: 4,800
‣ Volatility should continue to contract into 2/14 VIX expiration – 2/16 equity expiration. Major downside “risk-off” occurs on a break of 4,900, which is our first major support. 5,000 – 5,015 (SPY 500) is major resistance.*
*updated 2/9. Our view above, from 2/7, was updated to account for the huge gamma size at SPY 500 (SPX 5,015 equivalent).
Founder’s Note:
ES Futures are down 35bps to 5,025. NQ futures down 58 bps to 17,860.
Key SG levels for the SPX are:
- Support: 5,020 (SPY500), 5,000 4,968
- Resistance: 5,032, 5,050
- 1 Day Implied Range: 0.67%
For QQQ:
- Support: 433, 430
- Resistance: 440
Call Wall
IWM:
- Support: 200, 196, 190
- Resistance: 210
Call Wall
5,000-5,015 remains the focal/
pivot
point for the S&P today. This is the largest zone of gamma, which should pull S&P prices in/cause mean reversion back to this area. To this point, yesterday saw a sharp rejection of 504 SPY/5,050 SPX (which is again resistance for today), with the S&P feeding back into 5,000 this AM.
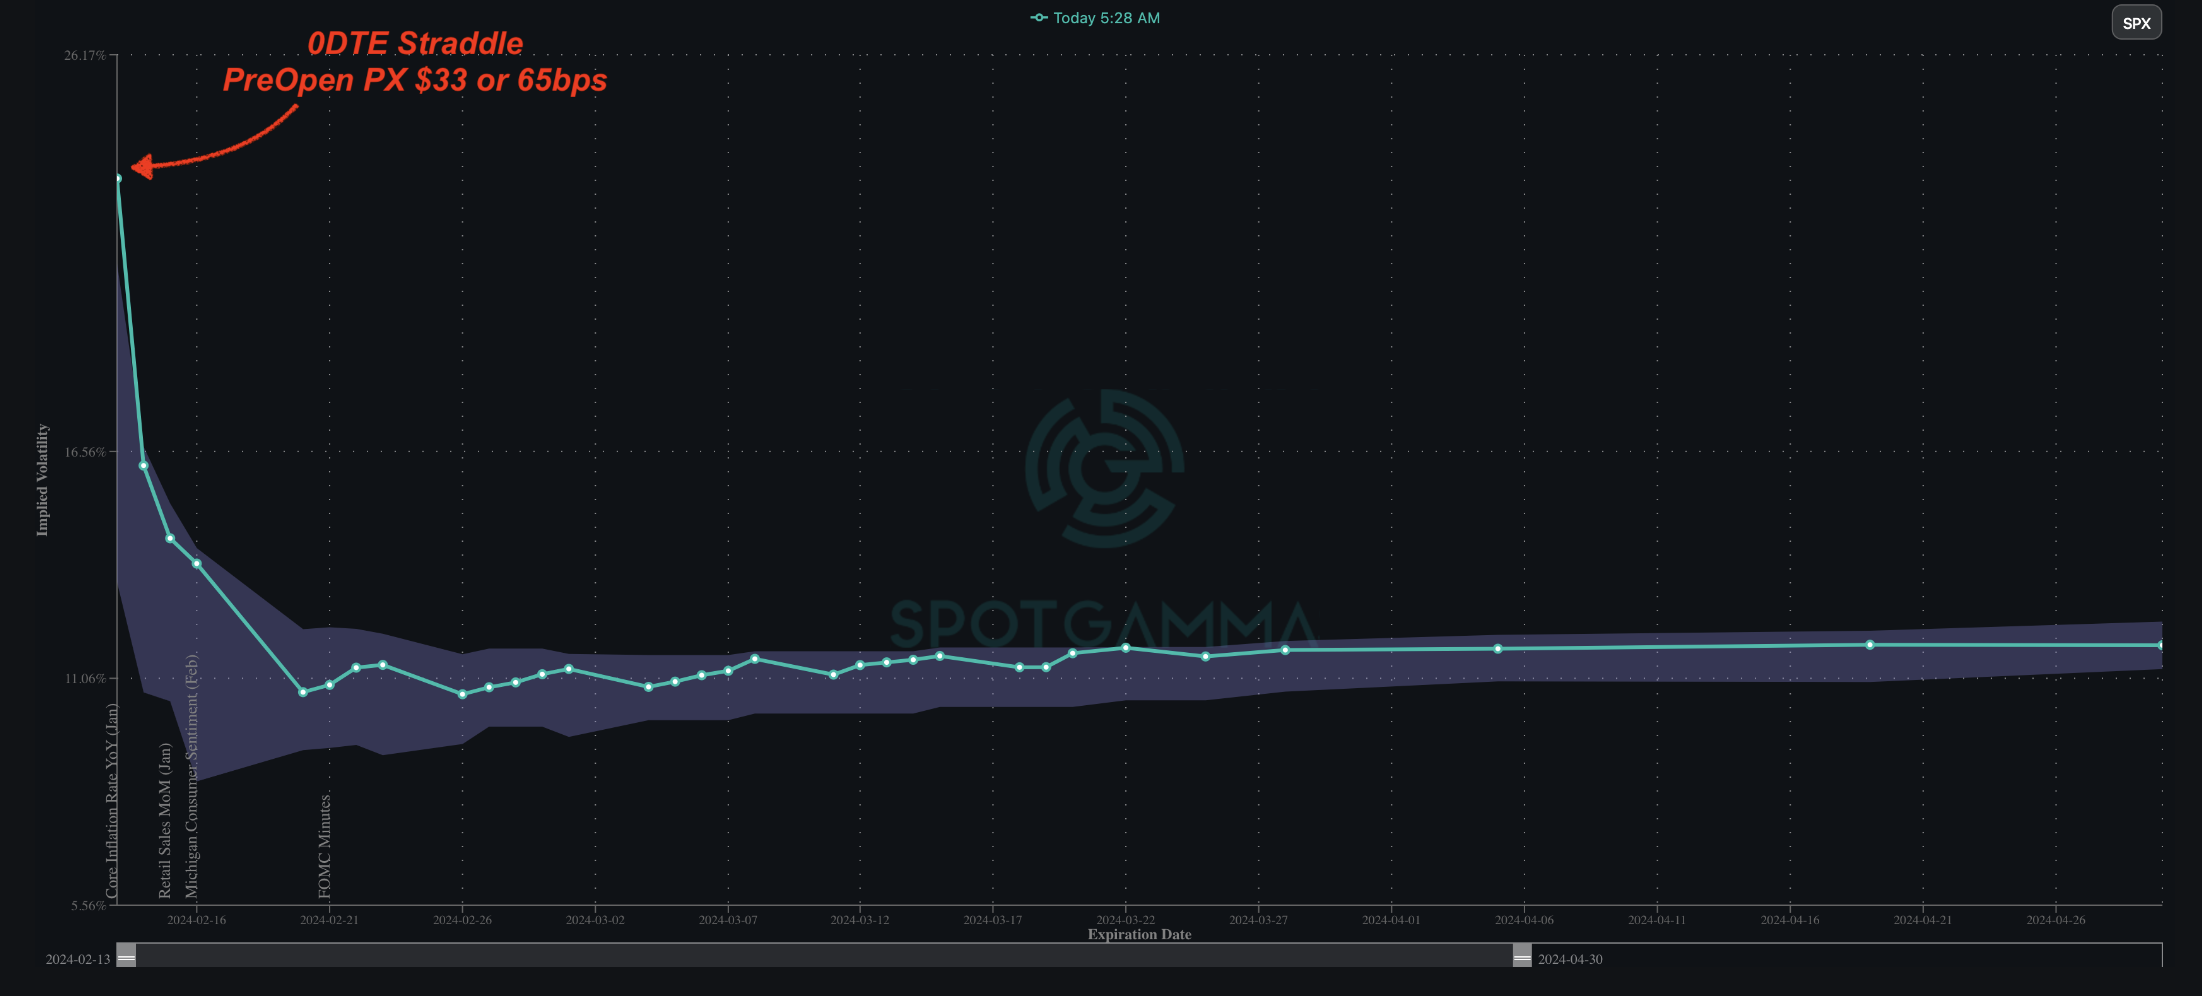
Anxiety seems to be shifting up slightly as markets await the 8:30AM CPI reading. As you can see, ATM IV’s are a bit elevated this morning, however today’s “high” reading is against the context of nearly 2 months of bullish trading behavior/low IV’s (i.e. the shaded cone). Framing this another way, while those IV’s may look a bit elevated, the 0DTE straddle is just 65bps, which is a pretty low bar for risk. The ~65bps of movement implied in today’s SPX straddle lines up with the SG 1-day implied move of 67bps, which is our models estimated SPX move today, and a fair one given a CPI print that comes inside of expectations.
However, should CPI come in hot, traders should respect a chance of a larger shift in downside volatility due the CPI feeding into positional shifts tied to tomorrow’s AM VIX expiration.
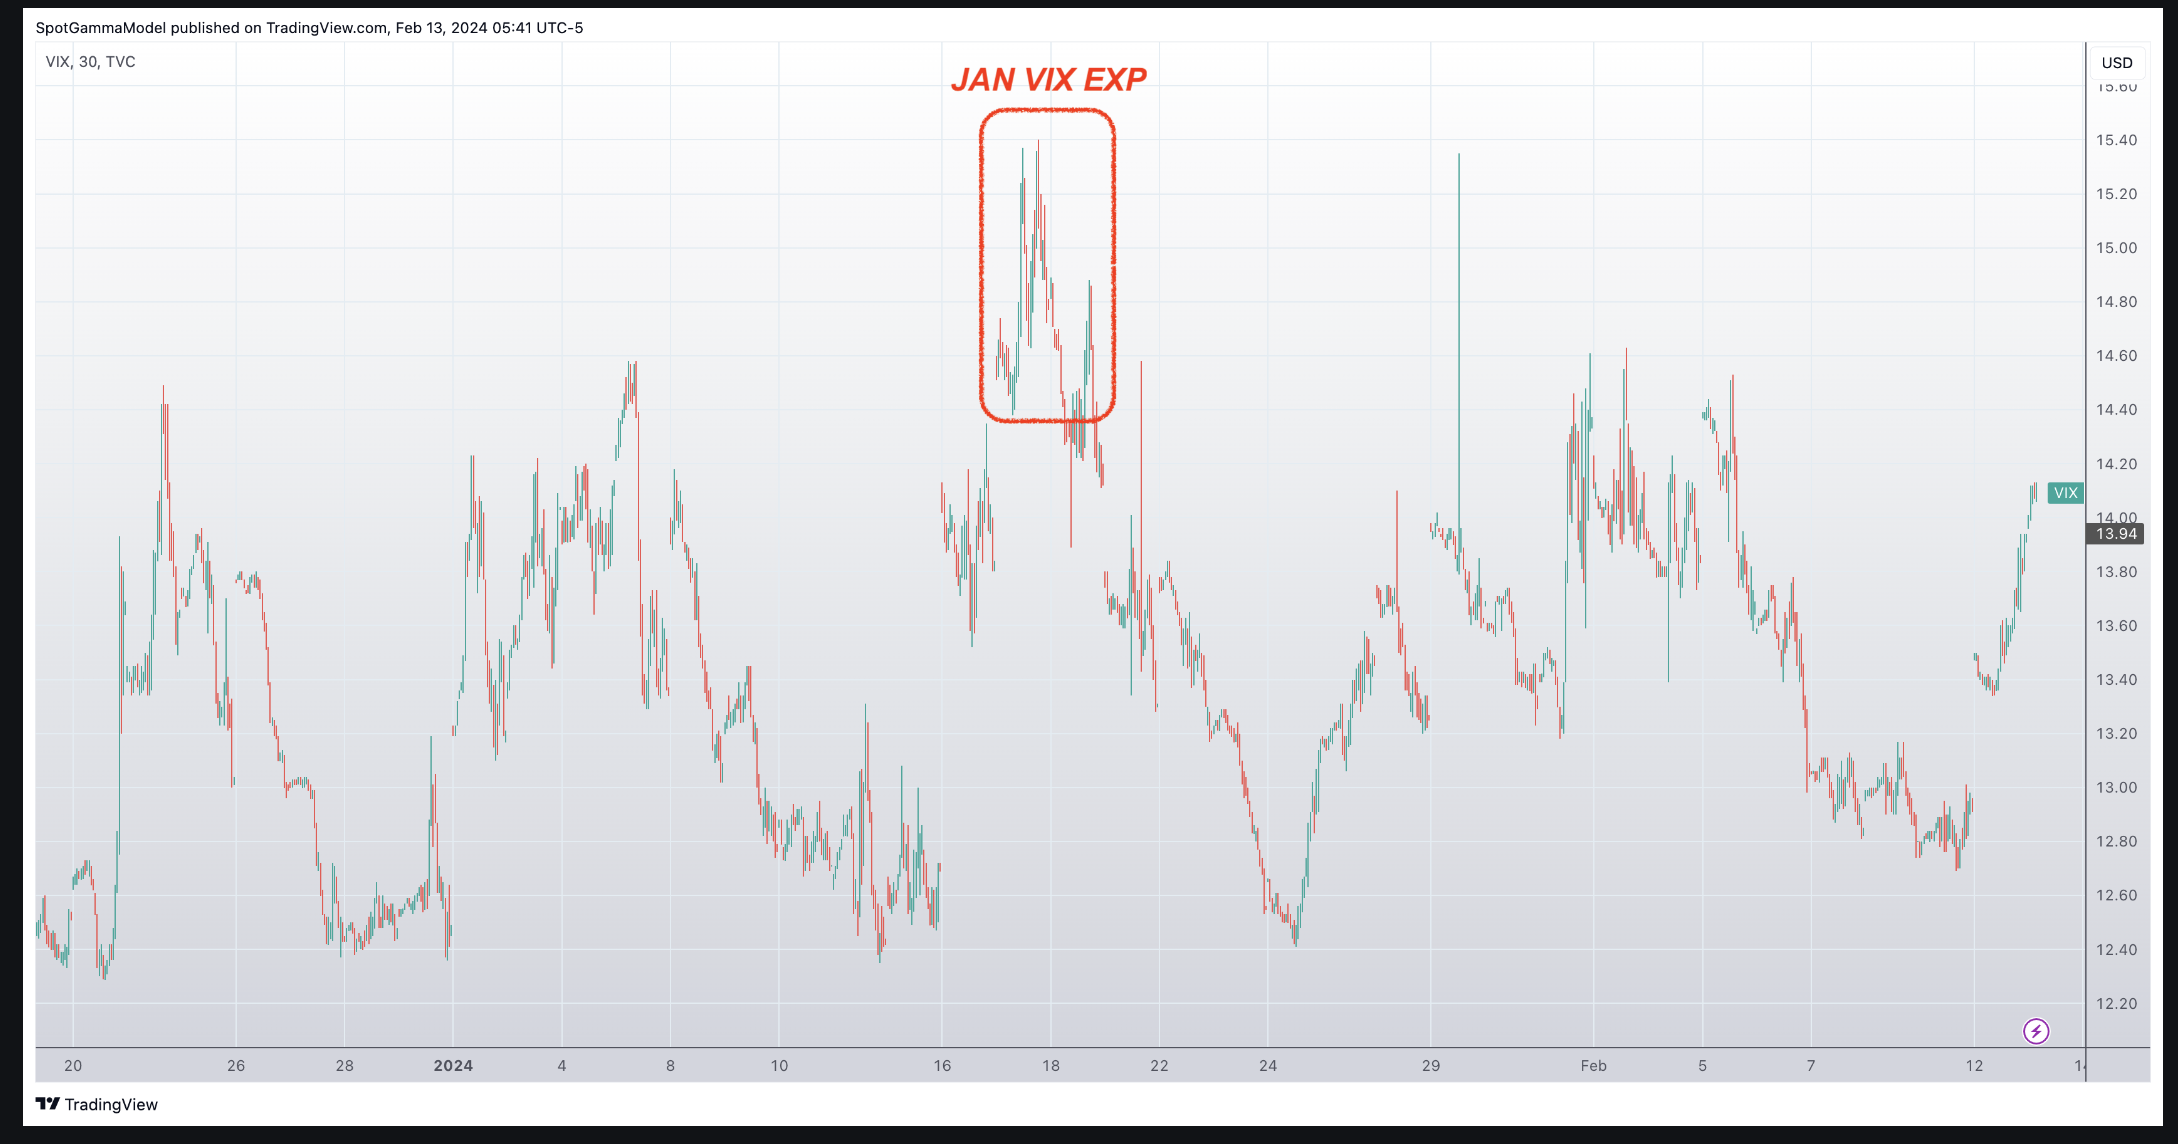
If you recall back to Jan’s VIX Exp, the rolling of large VIX positions resulted in a pop of VIX into the 15’s, and a brief 1% decline in the S&P. Equities are now more stretched to the upside, which could result in a bit more equity downside over the next few days. This has been the theme of our last few notes, as we’ve been harping on the crowded bullish trade, and highlighting this upcoming period of expirations as a window for possible consolidation. If you sprinkle in a hot CPI “excuse”, then the risk-off sentiment could trigger today.
Accordingly, we watch 4,900 as a material support area in the S&P500. Traders will be wanting to watch fixed strike vol into any weakness as a barometer for downside put demand. Lately when the S&P has weakened, we’ve seen put/vol sellers step in. Should these flows initiate around 4,900 then we’d look for a quick bounce back higher in the S&P. Should 4,900 break it could invoke a larger, prolonged decline, with a jump in implied volatility (i.e. VIX spike). With S&P put skew pretty cheap, the cost to hedge downside seems pretty reasonable. If you head out to +1-month options, the carry cost of puts/put spreads over the next week is pretty reasonable.
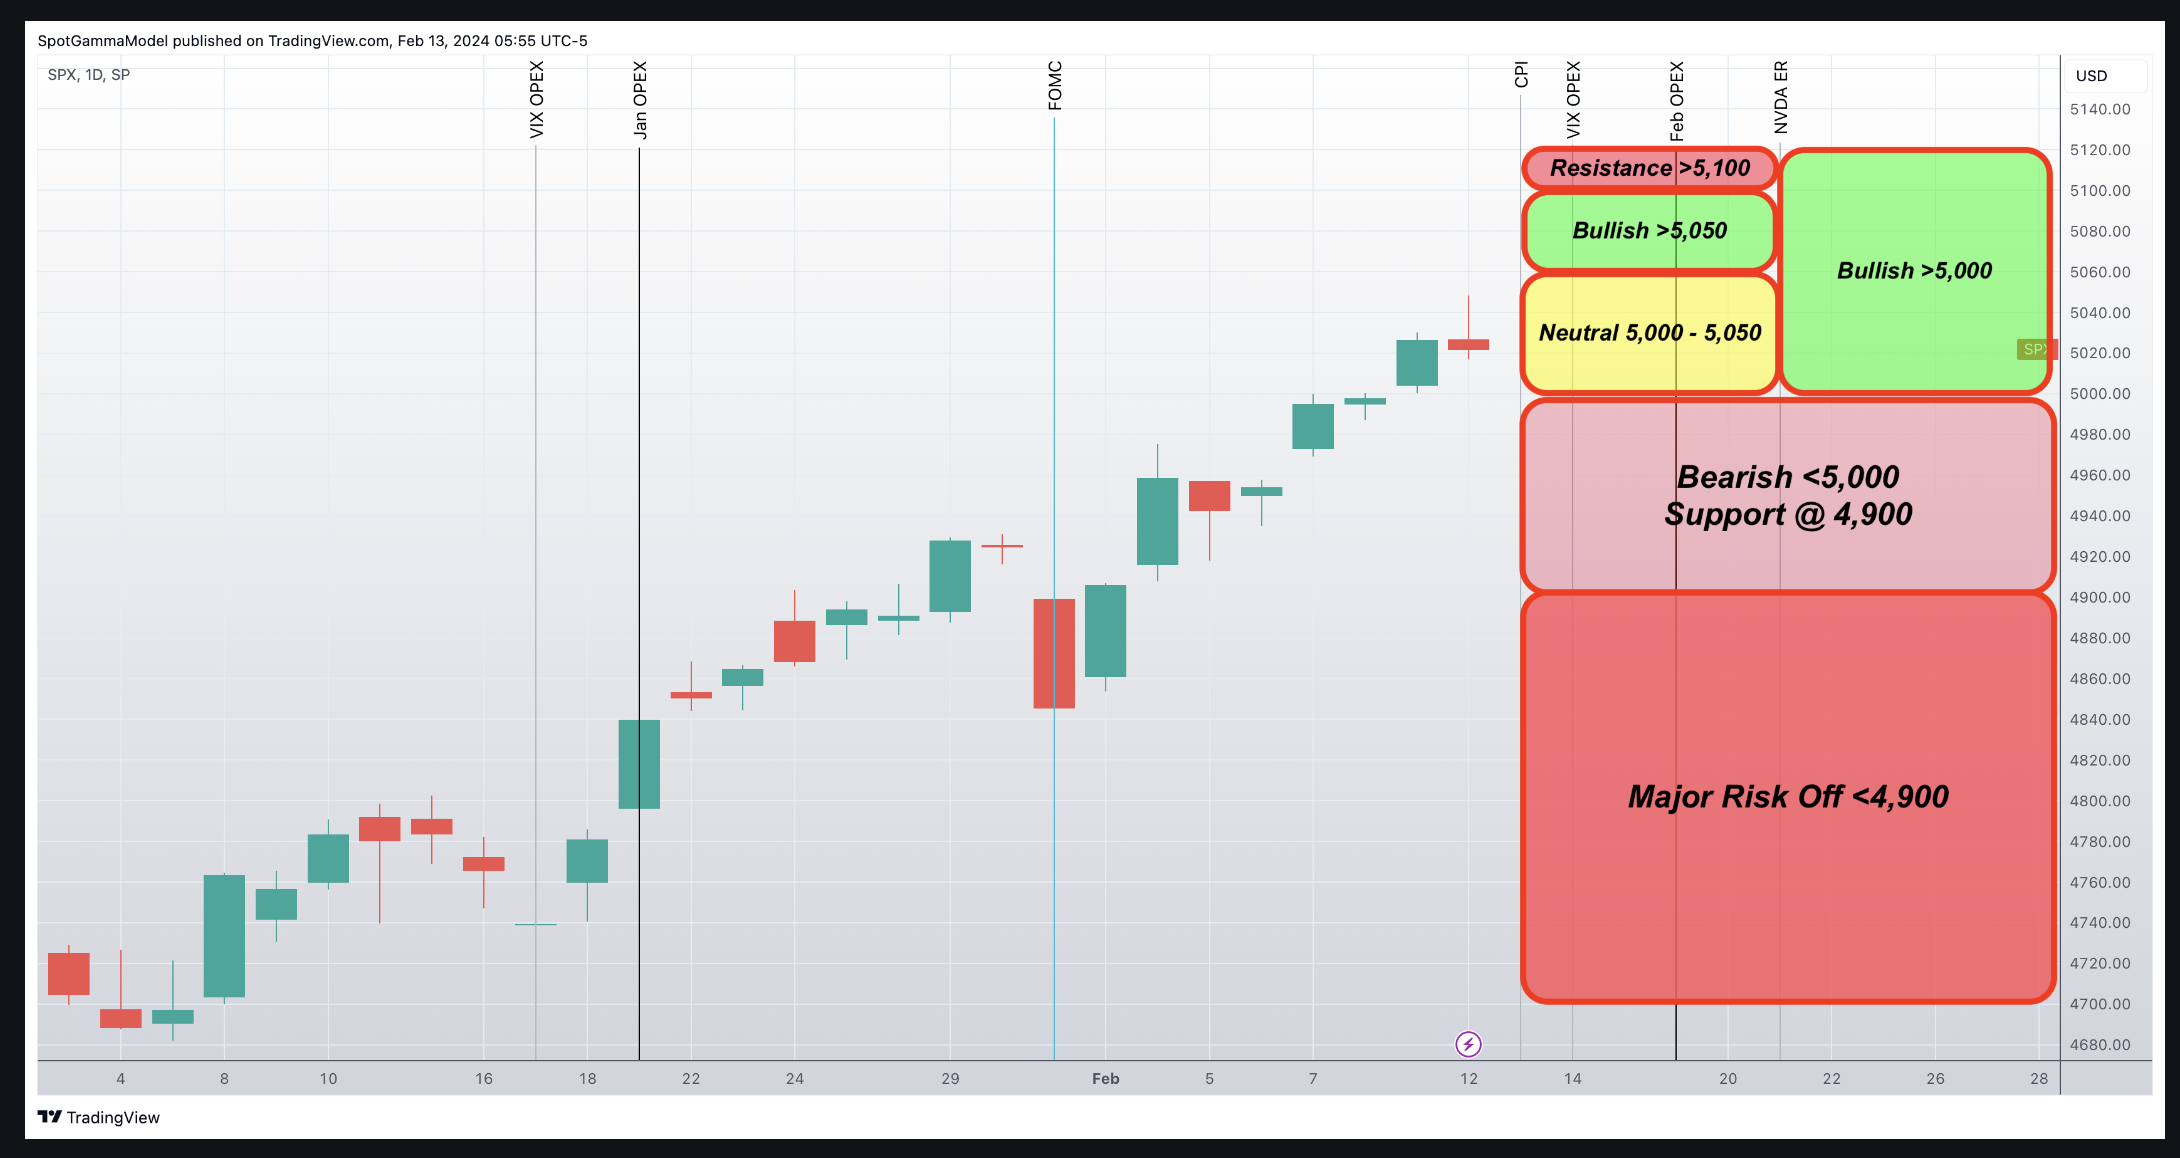
The map of forward pricing is shown below. As stated above, over the next several sessions we’re giving edge to consolidation down into the 4,900 level. Our base case is that a dip at that 4,900 level would be bought.
To the upside, bulls have control if the SPX >5,000. Due to the decay and shifting of this weeks VIX exp/OPEX positions, the upside for this week may be capped at 5,050, with 5,000 currently the “fair value” support strike. If the S&P comes out of the next week of trading (post 2/21 NVDA ER) >5,000, its a signal that the bullish trend is likely to resume into March.
| SpotGamma Proprietary Levels | SPX | SPY | NDX | QQQ | RUT | IWM |
|---|---|---|---|---|---|---|
| Reference Price: | $5021 | $500 | $17882 | $435 | $2045 | $202 |
| SpotGamma Implied 1-Day Move: | 0.67% | 0.67% |
|
|
|
|
| SpotGamma Implied 5-Day Move: | 1.83% |
|
|
|
|
|
| SpotGamma Volatility Trigger™: | $4945 | $498 | $17570 | $433 | $1990 | $196 |
| Absolute Gamma Strike: | $5000 | $500 | $18000 | $430 | $2000 | $200 |
| SpotGamma Call Wall: | $5000 | $502 | $18000 | $440 | $2100 | $210 |
| SpotGamma Put Wall: | $4600 | $470 | $16000 | $430 | $1850 | $190 |
| Additional Key Levels | SPX | SPY | NDX | QQQ | RUT | IWM |
|---|---|---|---|---|---|---|
| Zero Gamma Level: | $4955 | $496 | $16668 | $431 | $2025 | $199 |
| Gamma Tilt: | 1.363 | 1.179 | 1.715 | 1.183 | 1.12 | 1.278 |
| SpotGamma Gamma Index™: | 2.228 | 0.168 | 0.079 | 0.072 | 0.010 | 0.040 |
| Gamma Notional (MM): | $533.41M | $531.70M | $8.213M | $239.771M | $6.114M | $391.017M |
| 25 Delta Risk Reversal: | -0.033 | -0.027 | -0.035 | -0.02 | -0.003 | 0.007 |
| Call Volume: | 643.424K | 1.911M | 13.02K | 763.83K | 60.795K | 862.891K |
| Put Volume: | 1.145M | 2.595M | 19.526K | 1.172M | 87.51K | 707.517K |
| Call Open Interest: | 6.606M | 6.696M | 56.955K | 4.344M | 267.174K | 4.606M |
| Put Open Interest: | 13.815M | 16.165M | 77.357K | 8.449M | 480.471K | 8.459M |
| Key Support & Resistance Strikes |
|---|
| SPX Levels: [5000, 5050, 4900, 4950] |
| SPY Levels: [500, 502, 495, 501] |
| NDX Levels: [18000, 17600, 17850, 17625] |
| QQQ Levels: [430, 440, 434, 435] |
| SPX Combos: [(5248,88.87), (5198,98.06), (5172,85.39), (5162,74.32), (5152,96.11), (5127,91.00), (5122,74.37), (5117,72.21), (5112,84.90), (5102,99.65), (5092,82.47), (5082,93.78), (5077,97.59), (5072,92.13), (5067,72.16), (5062,94.98), (5057,77.80), (5052,99.73), (5047,83.15), (5042,93.05), (5037,74.03), (5032,97.75), (5027,96.99), (5022,90.96), (5017,94.70), (5012,93.42), (5002,99.87), (4982,75.33), (4977,80.85), (4952,90.30), (4911,80.68), (4901,82.74), (4851,82.61), (4801,82.82)] |
| SPY Combos: [508.51, 503.5, 498.49, 518.02] |
| NDX Combos: [18079, 18026, 17668, 17954] |
| QQQ Combos: [437.86, 435.69, 436.56, 447.86] |
0 comentarios