
Macro Theme:
Short Term SPX Resistance: 5,115
Short Term SPX Support: 5,060
SPX Risk Pivot Level: 5,000
Major SPX Range High/Resistance: 5,115 (SPY 510)
Major SPX Range Low/Support: 4,800
‣ We look for index volatility to now contract after hitting the 5,100 is the upside target.*
‣ 5,000 is critical support, up from 4,900 the week ending 2/16.*
‣ March Quarterly OPEX (3/15) is the next major inflection point.*
*updated 2/23
Founder’s Note:
ES futures are flat at 5,085. NQ futures are flat at 18,000.
Key SG levels for the SPX are:
- Support: 5,070, 5,060, 5,050
- Resistance: 5,100, 5,115 (SPY 510)
Call Wall
- 1 Day Implied Range: 0.67%
For QQQ:
- Support: 435
- Resistance: 440
Call Wall
IWM:
- Support: 195
- Resistance: 200, 210
Call Wall
It appears that the
Call Walls
of 5,100 SPX & 440 QQQ are going to continue offering resistance, which signals index volatility remaining low. With that, we see little index movement on the docket again, today, with major support at 5,060 (SPY 505) and SPX 5,050 and resistance at 5,100.
Yesterday maybe felt a bit more bearish that it was, with the SPX closing down 38 bps (just 1bp off the super-tight 39bps 0DTE straddle). That meager downside has not concerned options traders, as the 0DTE straddle is once again pricing in a “risk free” session of 39bps.
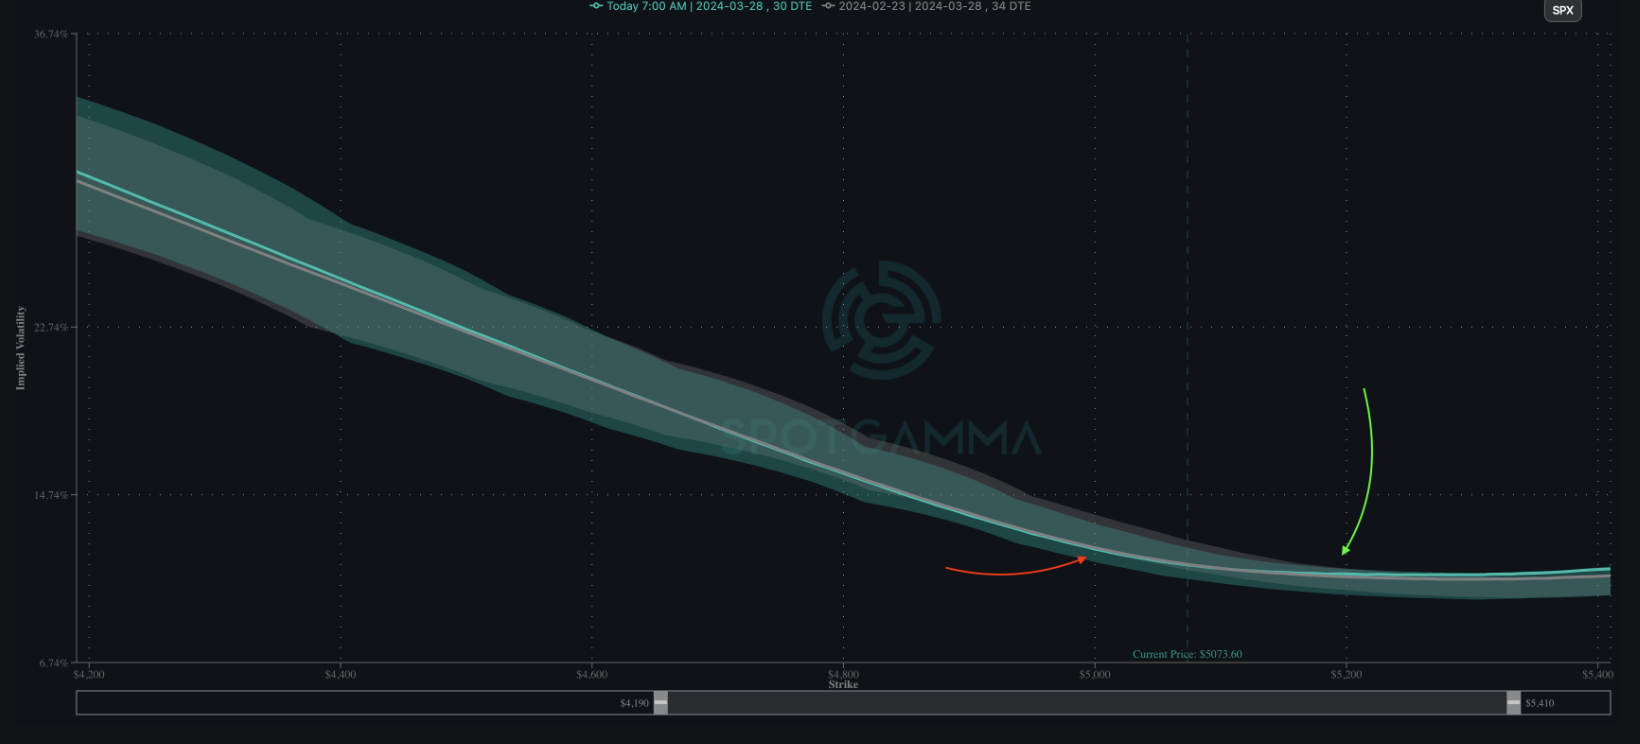
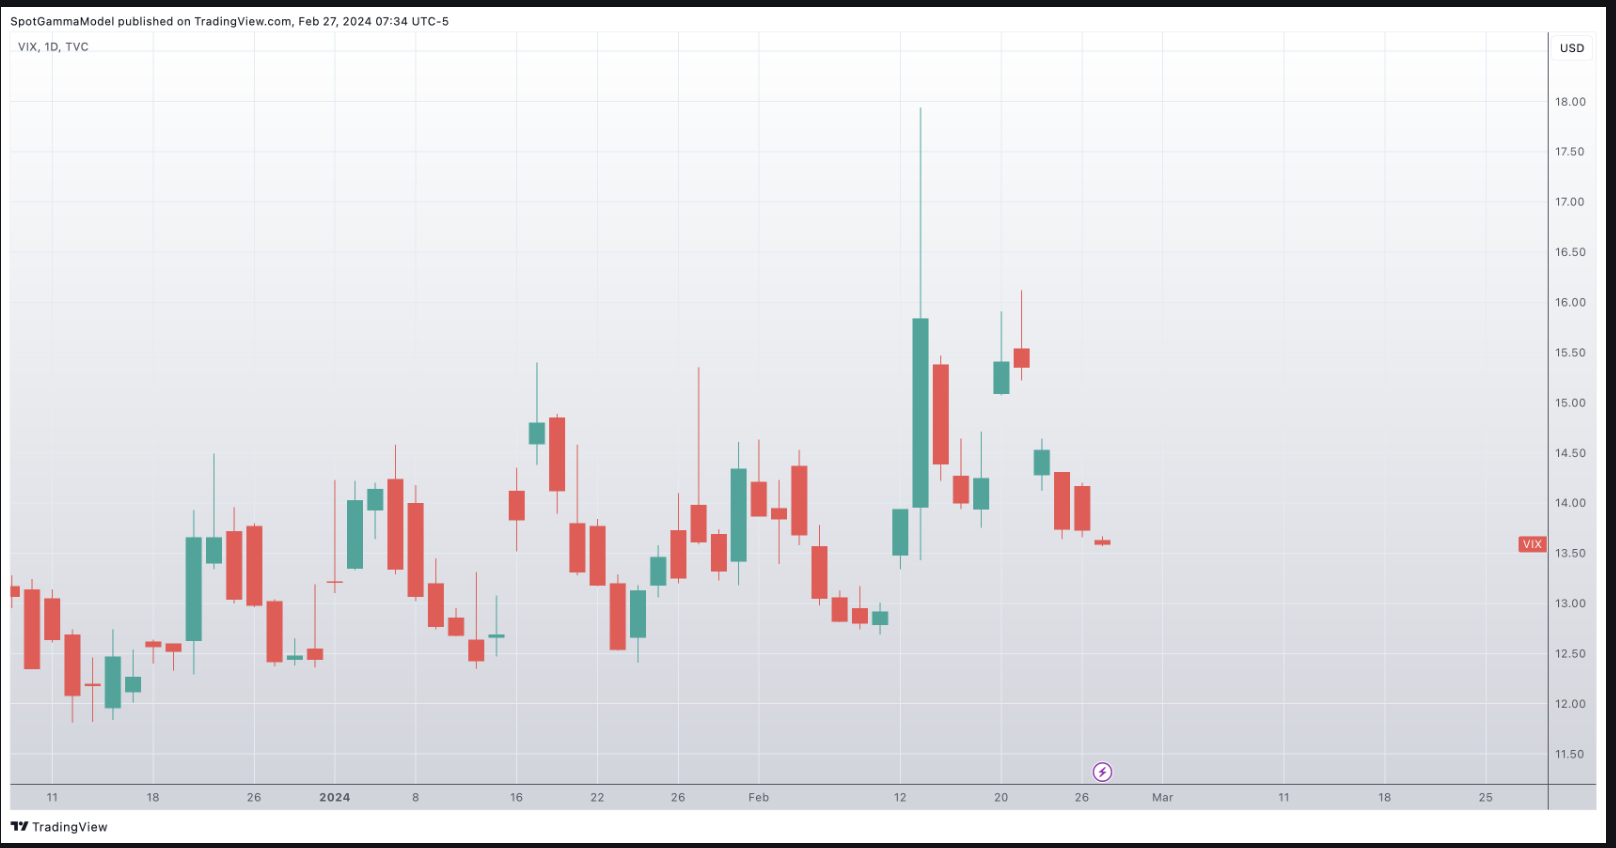
When we zoom out and look at 1-month SPX IV’s we see 1-2% downside protection at 2 month lows (red arrow), and 2% upside at 2 months highs (green arrow). Further, these IV’s are essentially unchanged from Friday’s (gray line) record closing SPX high. The VIX is also down at 13.6, which is two week lows.
Our view here is that until March OPEX there is little to shift current positions, which suggests that the bullish trend remains intact until/unless 5,000 is broken. 5,000 is a level that should offer substantial support. We reiterate that we only see higher index prices if the
Call Walls
roll to higher strikes.
“Stalled out”
Call Walls
, or even Walls that roll mildly higher, likely results in lower VIX prices into March OPEX. For this reason we are targeting a 12-handle VIX into mid March, and continue to think this is a prime time for those VIX ETN’s to decay (see Friday’s note).
Where volatility is erupting is in the crypto space, with yesterdays ~5% Bitcoin (BTC) move igniting stocks like COIN, MSTR and MARA (all were +15%). One has to assume that if BTC continues to break higher, that these stocks participate. In this case we entered into yesterday’s BTC jump with +95th %ile call skew readings in the big crypto names, suggesting some long call demand. This, we think, is a prime driver of their outperformance over BTC (i.e. the crypto stocks being +15% vs BTC up 5%).
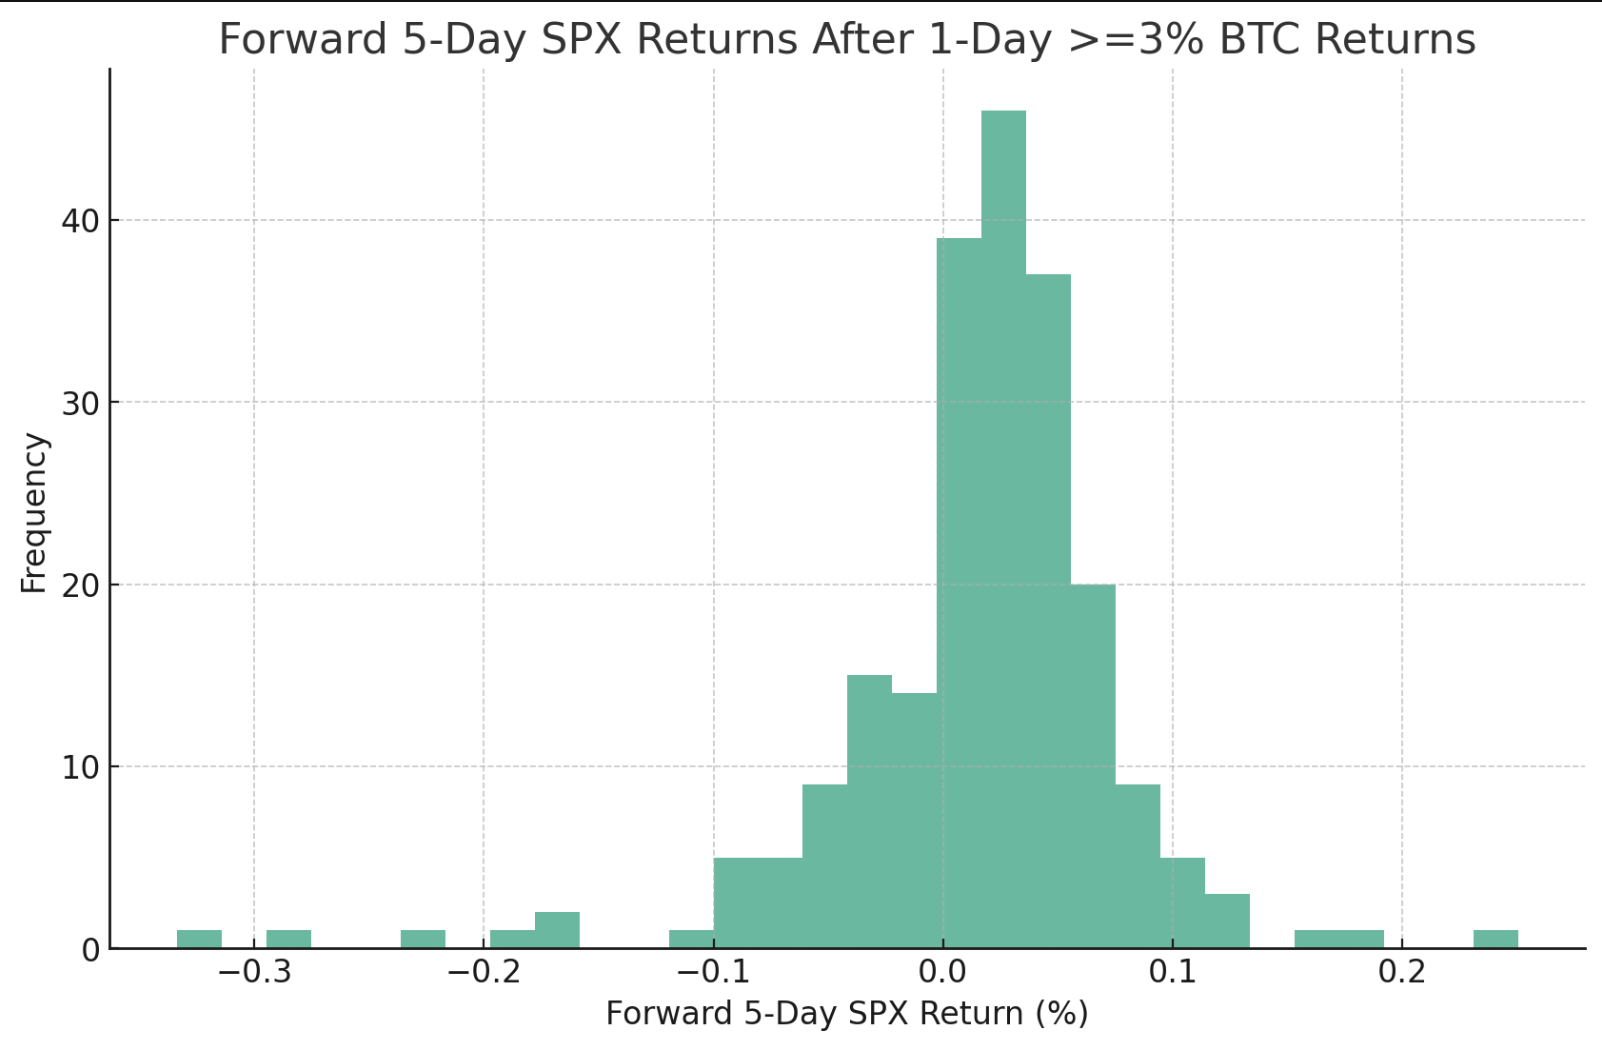
We’ve always thought that crypto performance is a broad measure of speculative sentiment. To test this idea we put together a quick measure of this, showing the forward 5 day SPX returns after 1 day +3% moves in BTC. As you can see, the SPX tends to exhibit positive returns after large jumps higher in BTC.
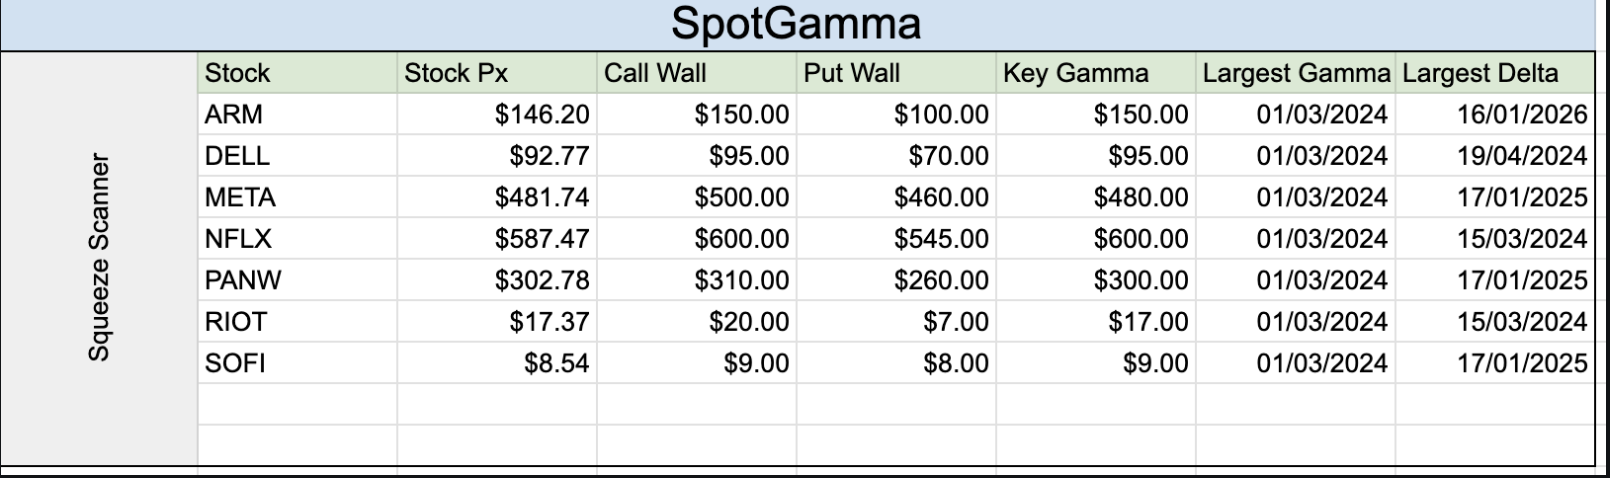
With dull index markets, we again turn to interesting single stock setups. In yesterday’s Q&A the output from our upcoming scanner upgrade was discussed, as the output from today’s squeeze scanner is posted below. These are names that we think may exhibit larger relative upside based on a proprietary blend of indicators. Generally we would use the stocks respective
Call Wall
(s) as the upside target.
| SpotGamma Proprietary Levels | SPX | SPY | NDX | QQQ | RUT | IWM |
|---|---|---|---|---|---|---|
| Reference Price: | $5069 | $505 | $17933 | $436 | $2028 | $201 |
| SpotGamma Implied 1-Day Move: | 0.67% | 0.67% |
|
|
|
|
| SpotGamma Implied 5-Day Move: | 2.02% |
|
|
|
|
|
| SpotGamma Volatility Trigger™: | $5070 | $506 | $17675 | $437 | $2015 | $199 |
| Absolute Gamma Strike: | $5000 | $500 | $17750 | $437 | $2000 | $200 |
| SpotGamma Call Wall: | $5100 | $510 | $17750 | $440 | $2050 | $210 |
| SpotGamma Put Wall: | $4500 | $503 | $16000 | $430 | $1950 | $195 |
| Additional Key Levels | SPX | SPY | NDX | QQQ | RUT | IWM |
|---|---|---|---|---|---|---|
| Zero Gamma Level: | $5002 | $505 | $17098 | $435 | $2039 | $199 |
| Gamma Tilt: | 1.214 | 0.971 | 1.564 | 0.997 | 0.889 | 1.06 |
| SpotGamma Gamma Index™: | 1.372 | -0.032 | 0.075 | -0.001 | -0.011 | 0.010 |
| Gamma Notional (MM): | $458.682M | ‑$65.446M | $8.075M | $43.691M | ‑$6.997M | $117.281M |
| 25 Delta Risk Reversal: | -0.021 | -0.019 | -0.017 | -0.017 | -0.001 | -0.011 |
| Call Volume: | 520.841K | 1.398M | 7.219K | 639.668K | 29.098K | 430.935K |
| Put Volume: | 917.144K | 1.976M | 10.523K | 1.004M | 49.646K | 491.626K |
| Call Open Interest: | 6.866M | 6.292M | 52.368K | 4.088M | 261.209K | 4.546M |
| Put Open Interest: | 13.658M | 15.879M | 66.72K | 7.937M | 473.449K | 7.955M |
| Key Support & Resistance Strikes |
|---|
| SPX Levels: [5000, 5100, 5050, 4900] |
| SPY Levels: [500, 505, 508, 510] |
| NDX Levels: [17750, 18000, 17600, 17625] |
| QQQ Levels: [437, 438, 435, 430] |
| SPX Combos: [(5298,95.81), (5277,76.25), (5252,93.91), (5227,83.37), (5211,77.34), (5201,99.17), (5176,87.58), (5171,81.24), (5161,88.65), (5151,98.65), (5141,83.48), (5130,93.47), (5125,95.06), (5120,89.55), (5115,86.95), (5110,95.06), (5100,99.84), (5095,72.63), (5090,94.13), (5080,82.94), (5075,92.77), (5064,72.11), (5059,87.48), (5054,74.77), (5039,90.25), (5034,71.54), (5029,81.77), (5019,76.32), (5014,88.37), (4999,87.87), (4948,71.49), (4923,71.63), (4902,82.21), (4852,83.10)] |
| SPY Combos: [507.97, 498.34, 518.11, 513.04] |
| NDX Combos: [17754, 18077, 17664, 18041] |
| QQQ Combos: [433.23, 439.8, 440.67, 430.61] |
0 comentarios