Macro Theme:
Short Term SPX Resistance: 5,160 (SPY 515 Call Wall)
Short Term SPX Support: 5,100
SPX Risk Pivot Level: 5,100
Major SPX Range High/Resistance: 5,200 SPX Call Wall
Major SPX Range Low/Support: 4,800
‣ 5,200 is the upside target.*
‣ 5,100 is critical support, up from 5,000 the week ending 3/1.*
‣ We look for index volatility to now contract (ref: 2/23, 1-month realized vol 14%, VIX 14.2).
‣ The week of 3/11 is the next major inflection point: 3/12 CPI & March Quarterly OPEX (3/15), followed by 3/20 VIX exp *
*updated 3/4
Founder’s Note:
ES futures are flat to 5,145. NQ futures are flat at 18,365.
Key SG levels for the SPX are:
- Support: 5,100, 5,115 (SPY 510)
- Resistance: 5,150, 5,160 (SPY 515
Call Wall
)
- 1 Day Implied Range: 0.67%
For QQQ:
- Support: 445, 440, 437
- Resistance: 450
Call Wall
IWM:
- Support: 200, 199
- Resistance: 210
Call Wall
There is little on the docket today in terms of data or earnings.
BTC, which can be seen as a proxy for equity risk, is making fresh highs today to 65,000. This is ~5% from all time highs of $69k.
The index options complex has largely rolled higher, filling in the area from 5,100 – 5,200. The SPY
Call Wall
now rests at 515, from 510, with the SPX Wall holding up at 5,200. 5,200 is the upside target, and we think the likely high into March OPEX (next week). The QQQ
Call Wall
also rolled higher, to 450, from its long standing position of 440.
We now have clear support levels at where the
Call Walls
were placed: 5,100 SPX and 440 QQQ. These are our new “risk off” levels.
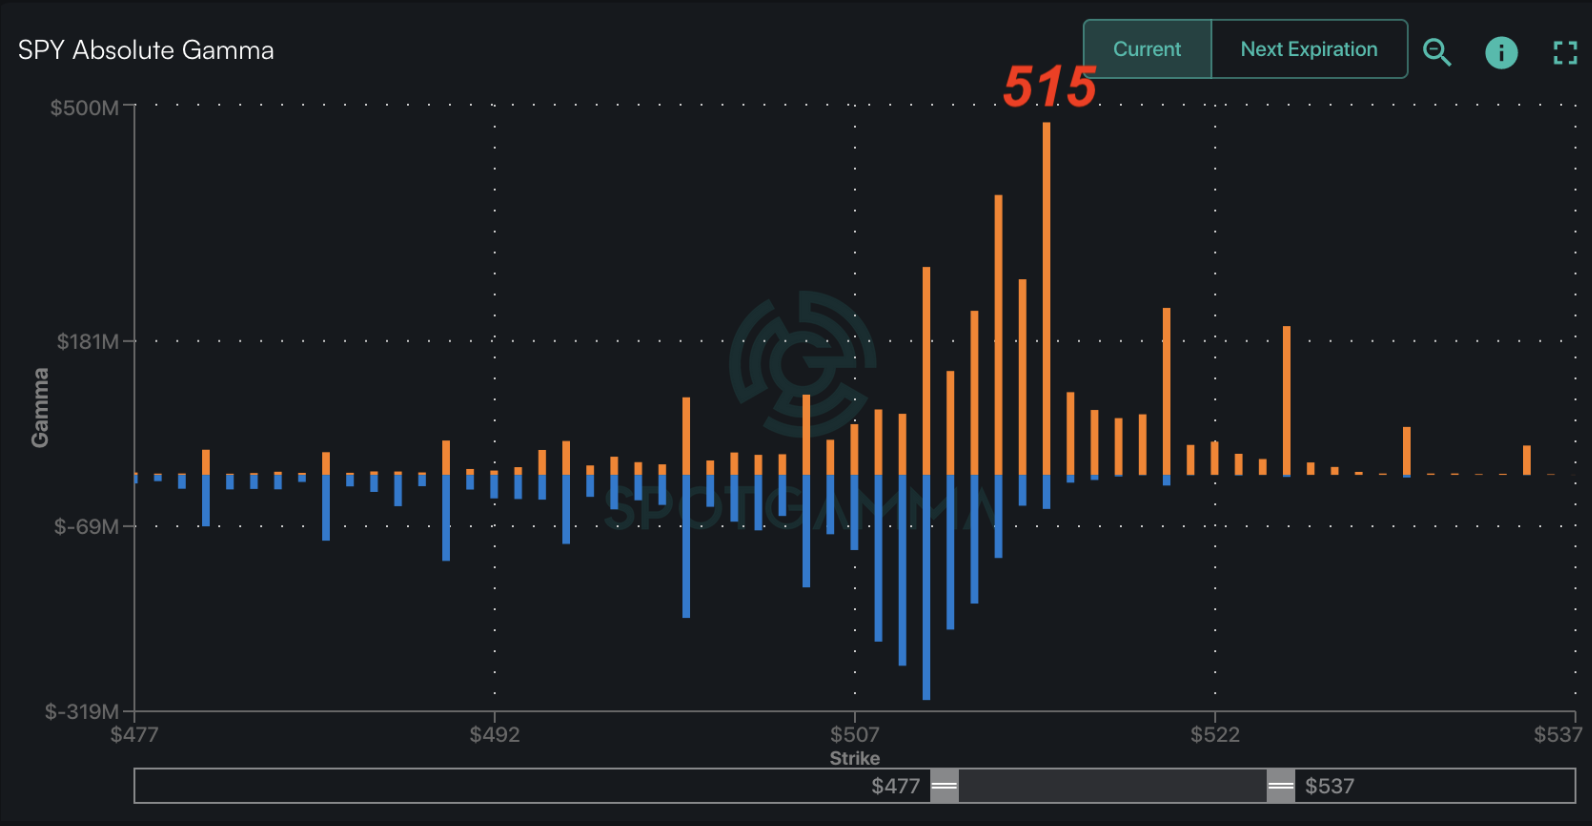
The key upside strike for today is SPY 515 (SPX 5,160 equivalent), which gained very large call positioning on Friday. This strike now also has the most
call gamma
of and index strike (i.e. bigger than any SPX or QQQ strike), which should offer short term resistance.
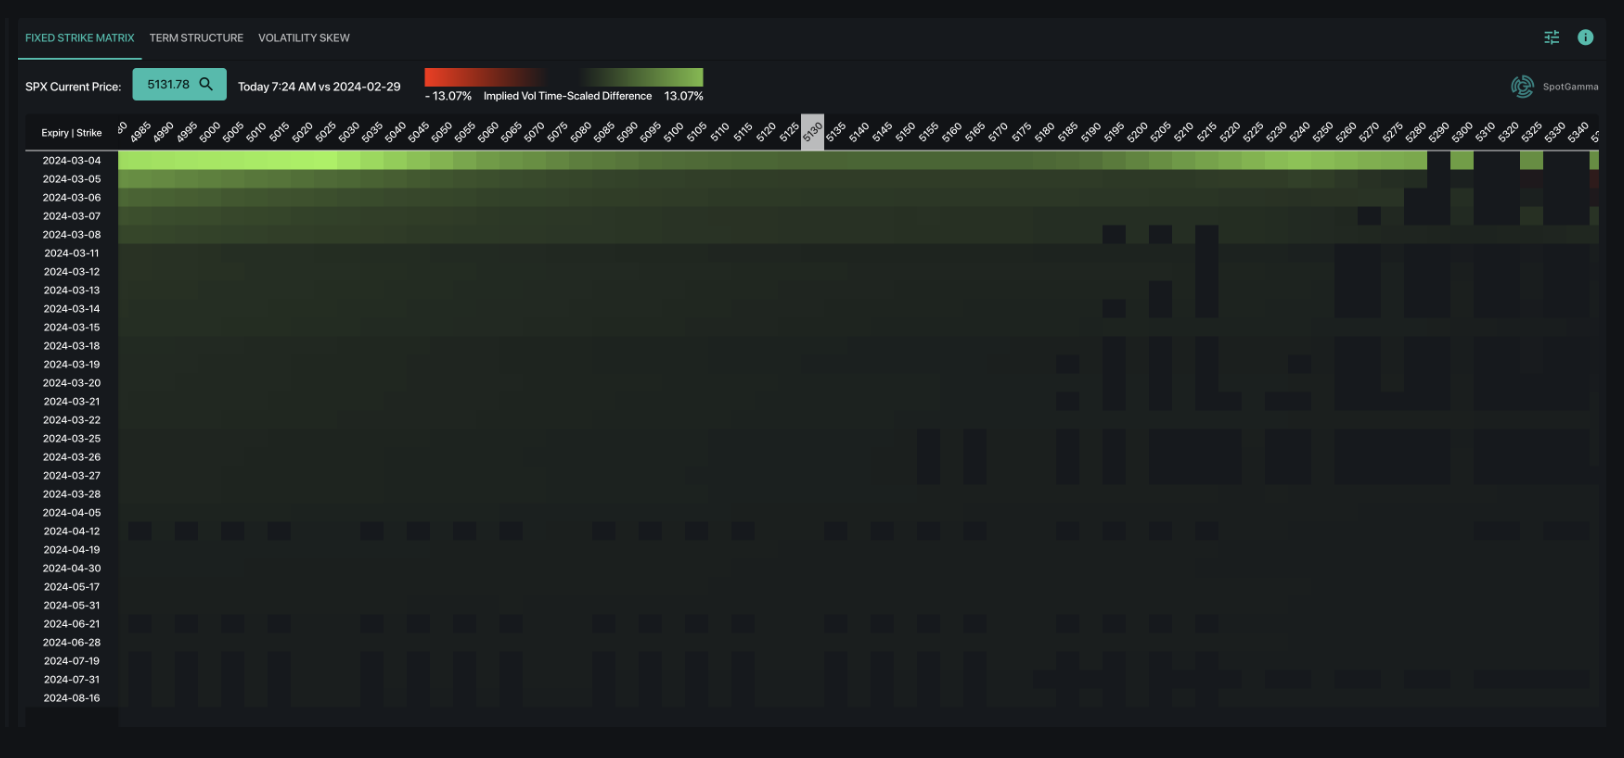
While that singular strike appears to have some short dated selling, longer dated S&P500 upside shows call buying. Shown here is our Fixed Strike Matrix for the SPX which compares IV for all strikes (x axis) across all expirations (y axis). This shows from Thursday’s close vs this morning and as you can see its a “sea of green”, which suggests that IV’s are up across the board. This is a sign of “stocks up, vol up”, which can occur during times of aggressive call buying.
In this case, we think that some short vol traders were offsides by the the bullish ISM report which drove interest rates lower, and a semi/AI related DELL/AVGO boost (stocks were +30%/+8% respectively after earnings).
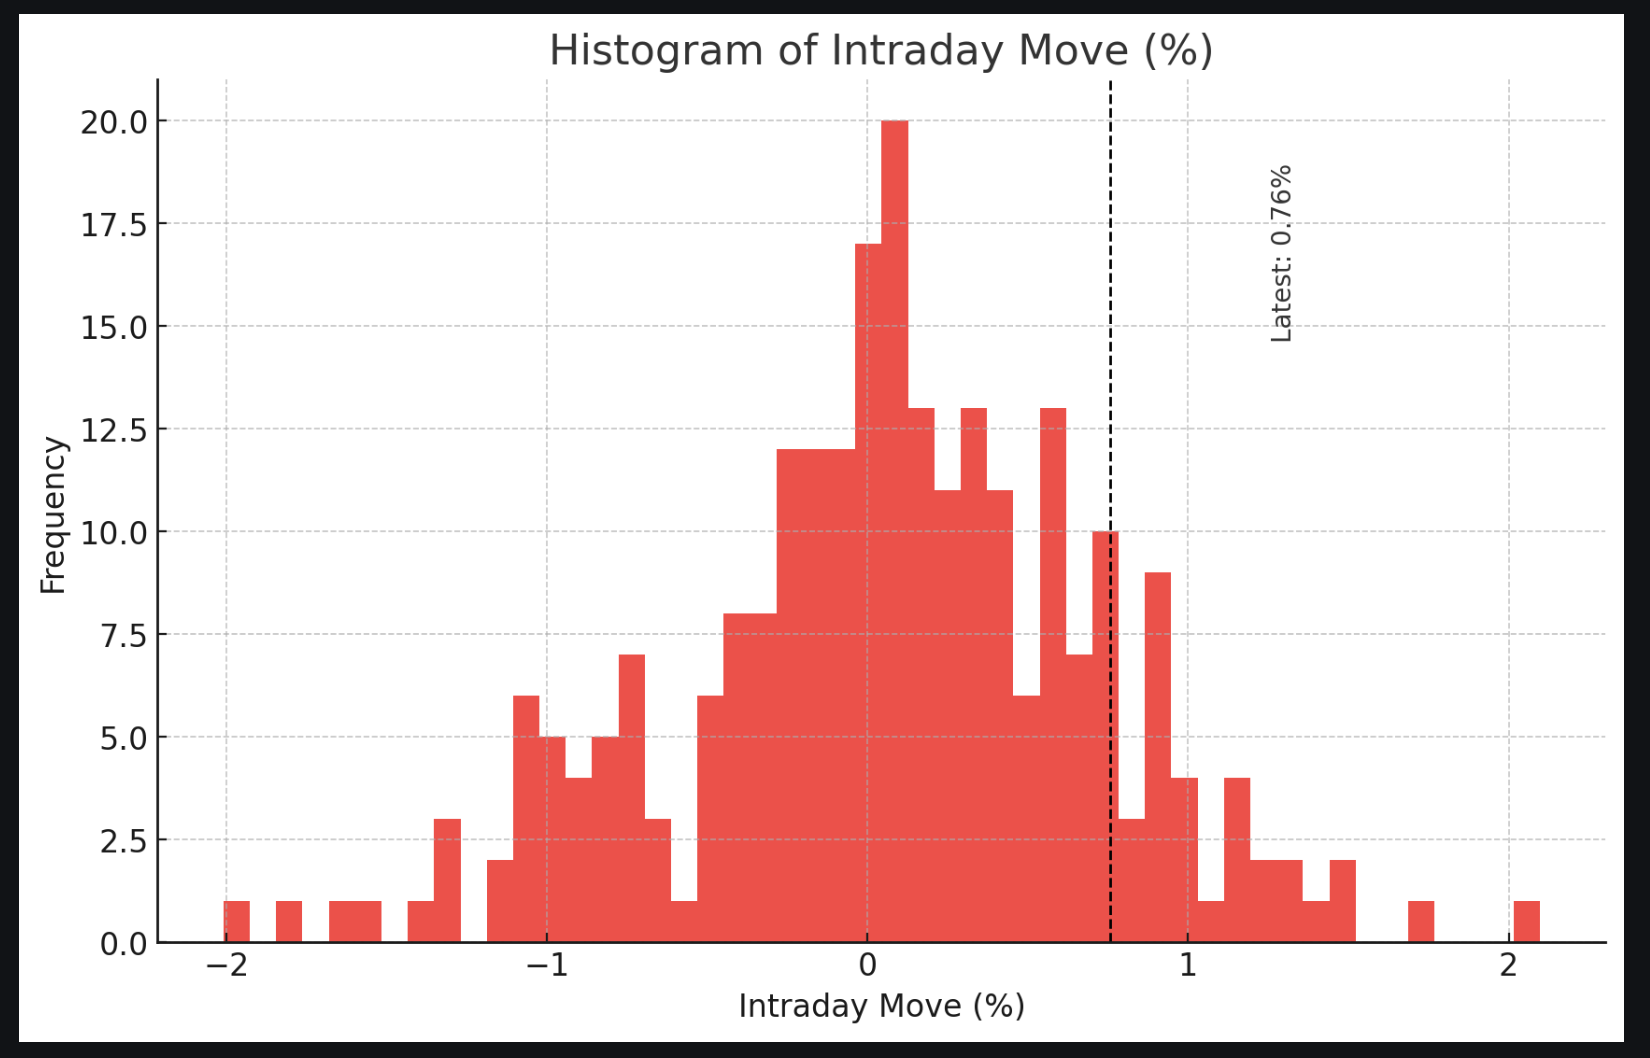
The S&P was up 76bps intraday, and 80 bps (Thurs. close to Fri close), which is a nice rally, but not a “door buster”, as you can see in the histogram of intraday SPX returns, below. This pales in comparison to the red-hot SMH (semi ETF), for example, which was up 4%.
The point here is that while there was some SPX “stock up, vol up” Friday, we think that we are still set to see SPX index volatility resume contraction, which means the VIX should be pressured into the 12’s through next week. The main reason this matters here is that single stocks are likely to continue their blistering outperformance of the broader indices. This may be particularly true if SPX “gets sticky” and pins around 5,150 area – 5,200 into OPEX, which is our belief.
Why does this outperformance matter?
Because the relative returns are drastically different between single stocks & indexes, it may invoke even more divergence due to reflexivity. For example, many who are just long the index are being left in the dust as their S&P holdings are up “just” 7% YTD, vs SMH that is up 30%. As a trader if you want to catch up (or keep up) to the stronger sectors, you likely need to buy into the stocks that are outperforming, which would in turn make the trade a more crowded long.
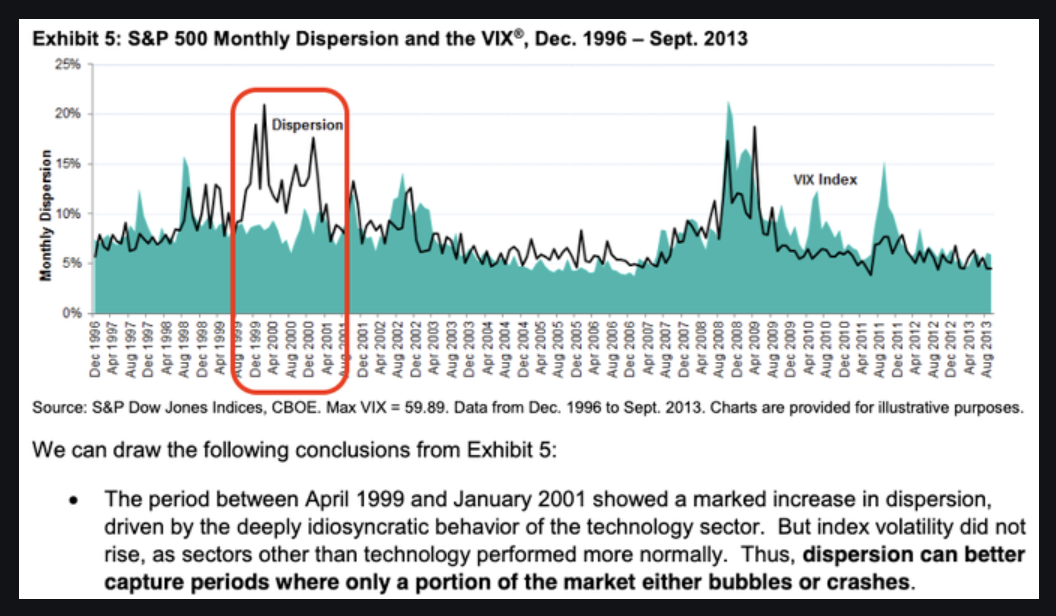
To this idea, on Friday we did an extensive analysis of some data from SPGlobal, which provided some metrics on dispersion & correlation. The “TLDR” of that post is that todays dispersion reading (blue lines, dispersion showing how much single stocks are moving) vs index volatility (orange lines) performance look a lot like the dot com bubble back in 2000. Dispersion metrics usually increase when stock markets crash, because that is usually when volatility really increases. Therefore you’d see “dispersion up, VIX up”. The fact that we now see “dispersion up, VIX flat” is a signal of excessive upside. Again, please see this post and/or this video for a detailed breakdown.
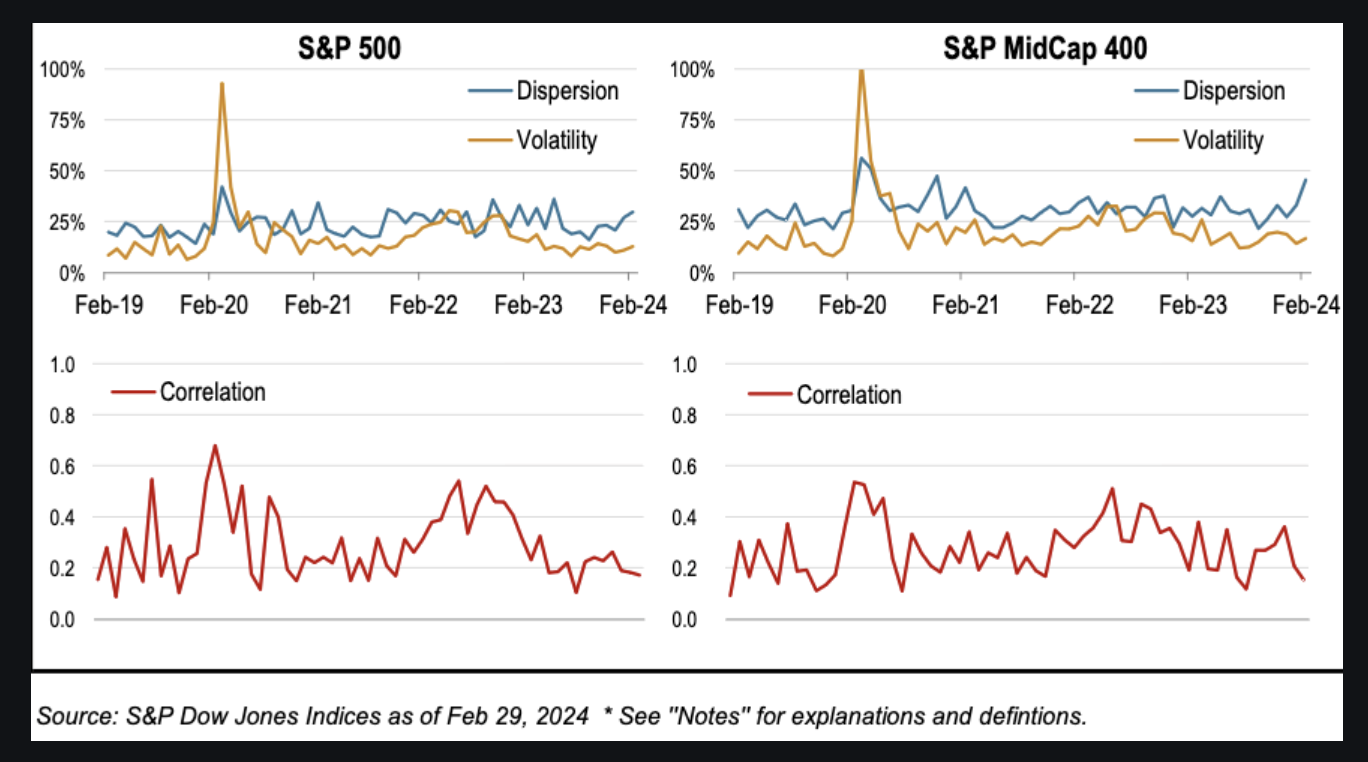
This bubble period is shown in the red box below, with dispersion in black and VIX (index vol) in green). We aren’t sure if there were nearer term examples of similar readings due to a lack of data from SPGlobal – but we suspect that a similar phenomenon occurred back in 2021.
The signal that the bubble is popping may likely appear in call skews flattening, and/or an increase in downside (i.e. puts) strike volatility. We think that the windows for these volatility shifts to occur are into and around options expirations, like we have next week.
For this week, the bulls maintain control with 5,100 major support, and 5,200 the upside target.
| SpotGamma Proprietary Levels | SPX | SPY | NDX | QQQ | RUT | IWM |
|---|---|---|---|---|---|---|
| Reference Price: | $5137 | $512 | $18302 | $445 | $2076 | $205 |
| SpotGamma Implied 1-Day Move: | 0.67% | 0.67% |
|
|
|
|
| SpotGamma Implied 5-Day Move: | 2.02% |
|
|
|
|
|
| SpotGamma Volatility Trigger™: | $4995 | $511 | $17690 | $437 | $2000 | $199 |
| Absolute Gamma Strike: | $5000 | $510 | $17750 | $440 | $2050 | $200 |
| SpotGamma Call Wall: | $5200 | $515 | $17750 | $450 | $2050 | $210 |
| SpotGamma Put Wall: | $4800 | $509 | $16000 | $425 | $1900 | $190 |
| Additional Key Levels | SPX | SPY | NDX | QQQ | RUT | IWM |
|---|---|---|---|---|---|---|
| Zero Gamma Level: | $5069 | $512 | $17189 | $438 | $2056 | $201 |
| Gamma Tilt: | 1.325 | 1.071 | 1.77 | 1.342 | 1.062 | 1.326 |
| SpotGamma Gamma Index™: | 1.659 | 0.068 | 0.084 | 0.117 | 0.005 | 0.046 |
| Gamma Notional (MM): | $740.196M | $316.311M | $8.857M | $517.831M | $6.317M | $436.961M |
| 25 Delta Risk Reversal: | -0.026 | -0.02 | -0.017 | -0.021 | -0.005 | -0.01 |
| Call Volume: | 660.512K | 2.102M | 14.648K | 1.04M | 19.357K | 397.772K |
| Put Volume: | 1.182M | 3.878M | 11.495K | 1.42M | 27.078K | 633.757K |
| Call Open Interest: | 6.883M | 6.144M | 54.31K | 4.119M | 271.486K | 4.665M |
| Put Open Interest: | 13.762M | 15.936M | 69.549K | 8.028M | 491.356K | 8.178M |
| Key Support & Resistance Strikes |
|---|
| SPX Levels: [5000, 5100, 5200, 5050] |
| SPY Levels: [510, 515, 513, 512] |
| NDX Levels: [17750, 18000, 17600, 17850] |
| QQQ Levels: [440, 444, 445, 446] |
| SPX Combos: [(5348,87.60), (5301,98.02), (5276,85.70), (5260,86.76), (5250,97.16), (5240,75.16), (5230,74.54), (5224,91.64), (5219,76.18), (5209,91.49), (5199,99.89), (5188,85.34), (5178,87.34), (5173,94.35), (5168,93.93), (5158,96.41), (5152,98.93), (5147,88.41), (5137,86.75), (5132,78.36), (5127,86.61), (5117,77.57), (5101,98.11), (5091,86.35), (5075,88.31), (5039,77.68), (5014,90.06), (5009,71.33), (4901,81.27)] |
| SPY Combos: [522.87, 513.13, 518.26, 533.12] |
| NDX Combos: [17754, 18486, 18449, 18394] |
| QQQ Combos: [447.24, 439.21, 446.35, 449.47] |
0 comentarios