
Macro Theme:
Key dates ahead:
- 6/10: CPI
- 6/12: SPACEX IPO
- 6/17: FOMC
- 6/18: OPEX
- 6/19: Juneteenth (mkt closed)
SG Summary:
Update 5/27: The positive gamma continues to support stocks. Oil back to 90 is allowing equity vol to come down, which adds bullish fuel. That said, we are reading very extreme call readings in the memory names, and in the QQQ as well. Given this, we want to maintain a core long position, but we will start to add some light downside plays for 2-3 months out, with the 6/12 SPACEX IPO circled as a major turning point. Additionally, we raise our Risk Pivot to 7,490, which is just below a large 30k lot call spread at 7,500.
5/12: We like owning June VIX calls as a hedge with Oil going >100. We also like put flies/ratios etc in the highest flying tech names (AMD, SNDK, MU, etc). These ideas are in the context of larger equity market support/volatility suppression from 5/15 OPEX to 5/20 VIX Exp/NVDA exp. Following that we look for a larger market move to come into play.
Key SG levels for the SPX are:
- Resistance: 7,600
- Pivot: 7,490 (bearish <, bullish >) updated 5/27/26
- Support: 7,550, 7,500
Founder’s Note:
Futures are up 15bps. CL is down 1% to 88.
We remain locked in SPX positive gamma – just as we have been for weeks. This supports SPX prices, with support at 7,560 and 7,540. Resistance is at 7,600.

As many of you know, the COR1M indicator took out the 8 level yesterday, which we view as a major signal of risk. This is a signal that upside, call-induced froth is in and of itself becoming a risk to the market. The critical thing to point out here is that many of our other metrics are flagging almost there for a full “red alert”, but not quite. We have certainly reached the point at which we will start dipping our toe into downside plays, and will look to move more meaningfully into these short positions over the next week.
Here is the great thing about piecing into a few short positions: puts are cheap as no one wants them.
The reason we hold off on heavily shorting is because its also in these late innings of froth that massive gains are made. Nearly every day some stock or sector is ripping +20%. Today is DELL, which is 30% higher after earnings. That is risk-on behavior.
Consider below, where we plotted out a matrix of IV Rank (x-axis) vs Skew Rank (y-axis). We summed the number of days a given stock landed in the matrix, with the top 25 stocks in the SPX (left) and NDX (right). Additionally we have plotted the most recent value for the top 25 names. What you see is nearly all the stocks are currently pinned to the top (skew rank +90), with many NDX constituent IV Ranks landing with IV Rank +60%. This is a “crash up”. To unwind these we need a catalyst, and as we’ve been highlighting the mid-June window offers catalysts in spades: CPI, SpaceX, OPEX, FOMC…maybe even oil.

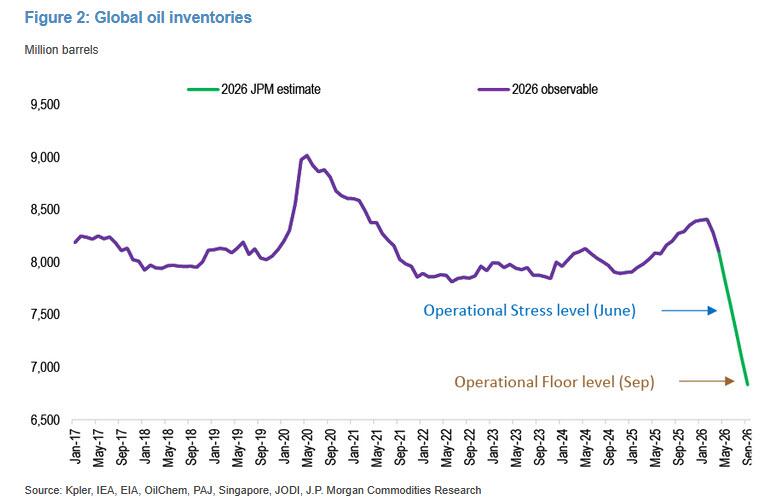
We’re certainly not energy analysts, but charts like this are making the rounds, with comments from XOM execs stating how dire things are getting: “You can debate whether that’s goin to hit, those really low levels, in two weeks or three weeks Once you get to that point, then you’ll see price shoot up.” We’ll see.
©2025 TenTen Capital LLC DBA SpotGamma
All TenTen Capital LLC DBA SpotGamma materials, information, and presentations are for educational purposes only and should not be considered specific investment advice nor recommendations. Futures, foreign currency and options trading contains substantial risk and is not for every investor. An investor could potentially lose all or more than the initial investment. Risk capital is money that can be lost without jeopardizing one’s financial security or lifestyle. Only risk capital should be used for trading and only those with sufficient risk capital should consider trading. Past performance is not necessarily indicative of future results. VIEW FULL RISK DISCLOSURE https://spotgamma.com/model-faq/disclaimer/
|
| /ESM26 | SPX | SPY | NDX | QQQ | RUT | IWM |
|---|---|---|---|---|---|---|---|
| Reference Price: | $7579.5 | $7563 | $754 | $30223 | $735 | $2936 | $292 |
| SG Gamma Index™: |
| 5.536 | 0.153 |
|
|
|
|
| SG Implied 1-Day Move: |
| 0.63% | 0.63% |
|
|
|
|
| SG Implied 5-Day Move: |
| 1.54% |
|
|
|
|
|
| SG Implied 1-Day Move High: |
| After open | After open |
|
|
|
|
| SG Implied 1-Day Move Low: |
| After open | After open |
|
|
|
|
| SG Volatility Trigger™: | $7411.5 | $7395 | $754 | $28050 | $734 | $2780 | $289 |
| Absolute Gamma Strike: | $7016.5 | $7000 | $755 | $29200 | $700 | $2800 | $290 |
| Call Wall: | $7616.5 | $7600 | $755 | $29200 | $740 | $3000 | $300 |
| Put Wall: | $7116.5 | $7100 | $730 | $27000 | $660 | $2780 | $282 |
| Zero Gamma Level: | $7367.5 | $7351 | $747 | $29473 | $728 | $2885 | $291 |
| Key Support & Resistance Strikes |
|---|
| SPX Levels: [7000, 7500, 7600, 7550] |
| SPY Levels: [755, 750, 740, 760] |
| NDX Levels: [29200, 30000, 30500, 30100] |
| QQQ Levels: [700, 730, 735, 740] |
| SPX Combos: [(7896,94.47), (7851,91.29), (7828,85.12), (7821,65.51), (7798,98.13), (7775,76.59), (7768,71.45), (7753,95.58), (7738,69.09), (7722,90.91), (7715,67.62), (7707,71.17), (7700,98.98), (7692,68.47), (7677,96.68), (7670,89.51), (7662,80.95), (7647,99.70), (7639,93.53), (7632,93.21), (7624,97.36), (7617,98.15), (7609,93.19), (7601,99.95), (7594,91.57), (7586,99.50), (7579,99.63), (7571,91.60), (7564,98.78), (7549,92.64), (7541,71.55), (7526,89.89), (7503,96.77), (7488,85.91), (7450,83.15), (7443,70.77), (7435,65.84), (7427,83.62), (7352,68.23), (7314,69.96), (7299,76.56), (7201,70.15)] |
| SPY Combos: [758.72, 755.71, 751.21, 763.22] |
| NDX Combos: [30405, 30496, 29196, 31010] |
| QQQ Combos: [730.22, 735.33, 710.52, 739.7] |
|
| SPX | SPY | NDX | QQQ | RUT | IWM |
|---|---|---|---|---|---|---|
| Gamma Tilt: | 1.663 | 1.154 | 2.067 | 1.187 | 1.359 | 0.958 |
| Gamma Notional (MM): | $1.433B | $541.724M | $17.481M | $290.881M | $22.531M | ‑$22.836M |
| 25 Delta Risk Reversal: | -0.03 | -0.023 | -0.034 | -0.021 | -0.024 | -0.024 |
| Call Volume: | 697.554K | 1.208M | 10.015K | 805.478K | 20.824K | 270.499K |
| Put Volume: | 1.036M | 2.243M | 15.027K | 1.375M | 32.996K | 603.30K |
| Call Open Interest: | 9.755M | 5.882M | 91.482K | 4.563M | 240.841K | 3.021M |
| Put Open Interest: | 13.679M | 13.531M | 91.925K | 7.308M | 447.197K | 7.905M |
0 comentarios