
Macro Theme:
Key dates ahead:
- 6/24: MU earnings
- 6/25: CORE PCE
SG Summary:
Update: 6/23: Futures are at fresh lows, with eyes on the MU + PCE catalysts. If those catalysts do not spark buyers, we may see a sharp move lower into the JPM strike area of 7k into 6/30 OPEX. We may elect to buy Friday 7,500 area call flies to hedge against dip buying into these big catalysts.
6/18: Our base case into OPEX is a 1-2% correction (ref 7,475). If traders focus more on higher rates, the major downside support is 7,000 into 6/30 OPEX. To the upside, resistance is at 7,500, with more resistance building into 7,600. We think a sharp rally higher is on hold until more econ data depicts lower inflation/cooler economic data, with the first major econ data on 6/25 (CORE PCE).
Key SG levels for the SPX are:
- Resistance: 7,400, 7,500
- Pivot: 7,475 (bearish <, bullish >) updated 6/15/26
- Support: 7,330, 7,150
Founder’s Note:
Futures are down 1.3%, started by massive declines in KOSPI (-10%). KOSPI is simply a trigger into nasty positioning that was just waiting for a catalyst.
These weak markets hopefully come as no surprise to SG members, as we last week and again yesterday triggered <=8 readings on COR1M into a massive June OPEX. Current indicative SPX opening levels (7,375) are just below that of the post-FOMC spasm – a spasm that was kick-saved by an Iran deal into a 3-day weekend. The TLDR here is that MU ER tomorrow night and CORE PCE are big short term catalysts. If those events cannot spark a recovery, then we see the ultimate downside flush remaining as the SPX 7,000 area into 6/30.
Starting with the TRACE map, we show the Customer(buyside) position here. This highlights that buyside is short puts this AM (red zone on TRACE), which has market makers healthily $6bn long gamma into the 7,200s area. This signals market makers can buy into weakness, which could inhibit the speed of downside. The big question is: does the buyside cover these short puts into this weakness? Should that happen, it removes MM long gamma, which allows for quicker downside.
As we highlighted yesterday, this gamma positioning is reading as supportive, but that comes against very stretched single stock call positioning, a massive OPEX, increasing rate concerns, etc. With this we are seeing put skews steepen, with the week/week change in QQQ skew shown here for August expiration. This signals a different flavor of concern vs the July 5th spasm, which appeared to mainly be an exercise in call selling.
Its a bit hard to determine just how much unwind is imminent. There are bananas-level imbalances out there, but hitherto all dips have been scooped up – and scooped up violently. In this case, the selling may have a bit more legs as there is less upside Iran headline risk which has been a key utility for re-pumping markets (“We have a deal!”). Framing this whole thing, too, is the QQQ’s which are current -3% after being up 3% last week.
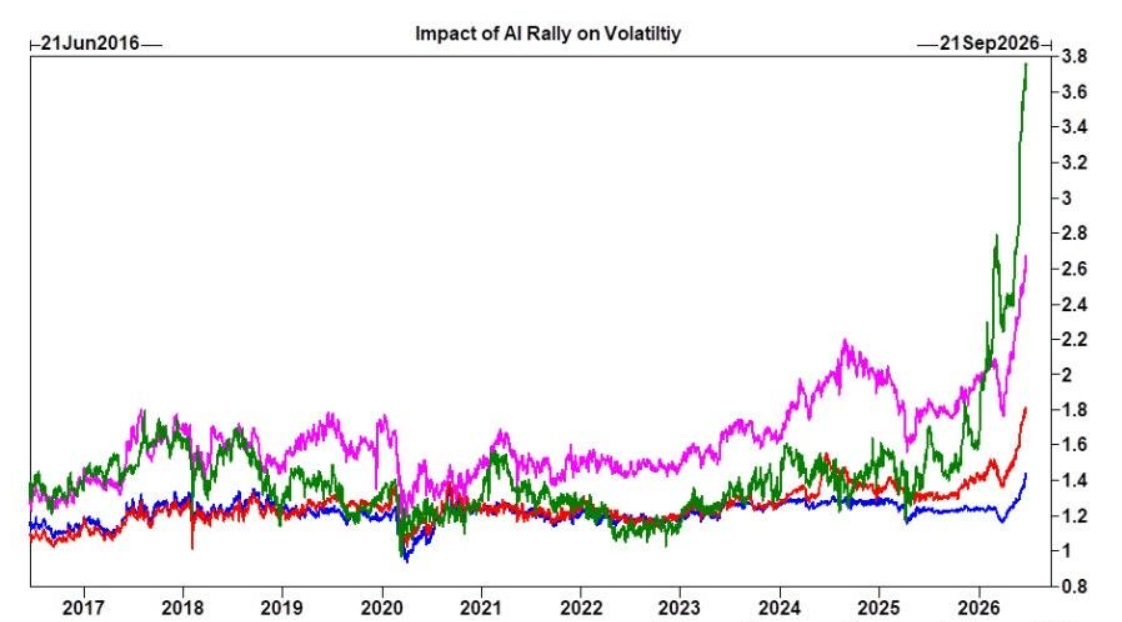
Here is a chart from GS (via Zerohedge) showing the spread in vol in between SPX and EWY/KOSPI (green), SMH (pink), and XLK (red). This vol spread is all due to tech stocks crashing higher.
Its long been our view that this volatility cannot simply quiet down/mean revert with “calm upside” to these high-flying tech stocks because there has been so much short dated call buying activity. On this note today is the 5th largest KOSPI drop (10% vs record 12% in March 2026.)

A hilarious anecdote as to how crazy the Korean call buying got, we saw this 100:1 SK HYNIX call to put ratio on X (h/t dario)….

©2025 TenTen Capital LLC DBA SpotGamma
All TenTen Capital LLC DBA SpotGamma materials, information, and presentations are for educational purposes only and should not be considered specific investment advice nor recommendations. Futures, foreign currency and options trading contains substantial risk and is not for every investor. An investor could potentially lose all or more than the initial investment. Risk capital is money that can be lost without jeopardizing one’s financial security or lifestyle. Only risk capital should be used for trading and only those with sufficient risk capital should consider trading. Past performance is not necessarily indicative of future results. VIEW FULL RISK DISCLOSURE https://spotgamma.com/model-faq/disclaimer/
|
| /ESU26 | SPX | SPY | NDX | QQQ | RUT | IWM |
|---|---|---|---|---|---|---|---|
| Reference Price: | $7540.02 | $7472 | $744 | $30347 | $738 | $3004 | $298 |
| SG Gamma Index™: |
| -0.006 | -0.385 |
|
|
|
|
| SG Implied 1-Day Move: |
| 0.62% | 0.62% |
|
|
|
|
| SG Implied 5-Day Move: |
| 1.52% |
|
|
|
|
|
| SG Implied 1-Day Move High: |
| $7406.99 | $738.1 |
|
|
|
|
| SG Implied 1-Day Move Low: |
| $7315.71 | $729 |
|
|
|
|
| SG Volatility Trigger™: | $7558.02 | $7490 | $745 | $30190 | $736 | $2950 | $294 |
| Absolute Gamma Strike: | $7068.02 | $7000 | $750 | $30400 | $740 | $3000 | $290 |
| Call Wall: | $7668.02 | $7600 | $800 | $30325 | $750 | $2965 | $300 |
| Put Wall: | $7468.02 | $7400 | $735 | $28000 | $700 | $2850 | $290 |
| Zero Gamma Level: | $7497.02 | $7429 | $748 | $29372 | $736 | $2997 | $302 |
| Key Support & Resistance Strikes |
|---|
| SPX Levels: [7000, 8000, 7500, 7600] |
| SPY Levels: [750, 740, 745, 735] |
| NDX Levels: [30400, 30325, 30500, 30000] |
| QQQ Levels: [740, 730, 735, 720] |
| SPX Combos: [(7824,69.41), (7802,95.73), (7772,68.13), (7749,87.44), (7727,85.34), (7697,96.39), (7675,81.37), (7652,94.34), (7630,70.34), (7622,88.64), (7607,80.42), (7600,96.85), (7592,78.97), (7577,94.12), (7570,67.70), (7562,85.97), (7548,91.51), (7540,74.14), (7533,83.97), (7525,89.84), (7518,82.87), (7503,88.15), (7488,69.00), (7480,72.23), (7473,76.02), (7465,76.60), (7458,91.94), (7450,86.54), (7443,85.58), (7435,65.59), (7428,93.83), (7420,78.37), (7413,74.33), (7406,69.61), (7398,98.65), (7391,87.26), (7383,77.95), (7376,91.88), (7368,80.78), (7361,82.94), (7353,91.46), (7346,78.25), (7338,84.41), (7331,83.78), (7323,94.86), (7308,85.49), (7301,95.20), (7293,68.83), (7278,91.95), (7271,67.83), (7249,86.88), (7226,83.07), (7196,95.21), (7174,67.33), (7151,85.20), (7129,66.62), (7122,69.96)] |
| SPY Combos: [756.3, 766.75, 776.45, 736.88] |
| NDX Combos: [30317, 30408, 31045, 30499] |
| QQQ Combos: [737.47, 755.22, 739.69, 754.48] |
|
| SPX | SPY | NDX | QQQ | RUT | IWM |
|---|---|---|---|---|---|---|
| Gamma Tilt: | 0.999 | 0.692 | 1.832 | 0.858 | 1.006 | 0.733 |
| Gamma Notional (MM): | $95.801M | ‑$699.55M | $13.384M | ‑$65.771M | $2.049M | ‑$238.665M |
| 25 Delta Risk Reversal: | -0.051 | 0.00 | -0.07 | -0.048 | 0.00 | -0.026 |
| Call Volume: | 641.244K | 1.455M | 8.452K | 829.294K | 22.032K | 217.685K |
| Put Volume: | 1.006M | 1.546M | 8.682K | 1.179M | 41.623K | 478.432K |
| Call Open Interest: | 8.867M | 5.764M | 71.391K | 4.096M | 182.689K | 2.452M |
| Put Open Interest: | 12.268M | 12.23M | 74.628K | 6.139M | 372.373K | 6.689M |
0 comentarios