
Macro Theme:
Key dates ahead:
- 6/24: MU earnings
- 6/25: CORE PCE
SG Summary:
Update: 6/23: Futures are at fresh lows, with eyes on the MU + PCE catalysts. If those catalysts do not spark buyers, we may see a sharp move lower into the JPM strike area of 7k into 6/30 OPEX. We may elect to buy Friday 7,500 area call flies to hedge against dip buying into these big catalysts.
6/18: Our base case into OPEX is a 1-2% correction (ref 7,475). If traders focus more on higher rates, the major downside support is 7,000 into 6/30 OPEX. To the upside, resistance is at 7,500, with more resistance building into 7,600. We think a sharp rally higher is on hold until more econ data depicts lower inflation/cooler economic data, with the first major econ data on 6/25 (CORE PCE).
Key SG levels for the SPX are:
- Resistance: 7,400, 7,420, 7,450, 7,500
- Pivot: 7,475 (bearish <, bullish >) updated 6/15/26
- Support: 7,370, 7,350, 7,300
Founder’s Note:
Futures are 30bps higher, indicating and SPX open at 7,400.
MU earnings are tonight, with PCE tomorrow AM.
TLDR: light positive gamma again for MMs today, with resistance at 7,400 then 7,420 and 7,450. Support below is at 7,370 and 7,350. We think today is a “waiting on data day”, and so relative volatility may be lower vs yesterday.
We start off today with volatility surfaces, as yesterdays “baby spasm” failed to spark persistent downside. Instead, the opening dip was bought strongly – something market makers were positioned to do (long gamma in SPX + top single stocks). We also note that 70% of SPX call volume yesterday was 0DTE.
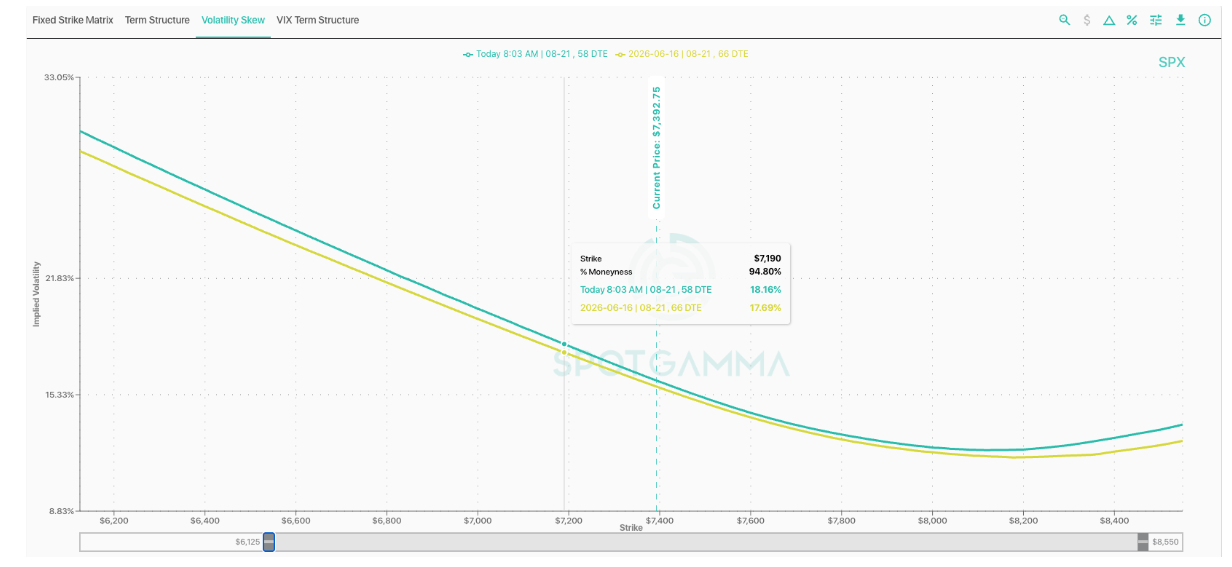
Shown here is 8/21 SPX skew from last week pre-FOMC (yellow) vs today. You can see we are only about 1 vol point higher, which quite frankly “ain’t much”, indicating traders are not terribly worried here (and/or that dealers are comfortably positioned).

Ultimately stocks appear to be in a wait-and-see mode, needing to see a bit of the MU earnings picture but more importantly upcoming econ data. This is validated by the SPX forward IV, which is quite elevated vs SPX term structure (black boxes). This is telling us that the vol implied between expirations is high due to these upcoming economic prints. From what we glean the deal here is that the market is pricing in a hike toward the end of this year, but the hope is that lower oil prices allow Warsh to punt on this hike. These new datapoints will help to codify these arguments. Looming over this is obviously the AI growth story, of which MU is leading indicator.

What is interesting about the overall position is that stocks seem to have gotten more volatile as the Iran was has been coming to an apparent close. You see this in the daily moves of the SPX over the last few weeks, with June holding much larger relative swings vs May, and, unbelievably, some stock-down days. This ties into this current battle of narratives between AI (and very rich call skews/positions) & now rates, with rates being a big potential threat to the CAPEX-heavy AI complex.

And, while we are seeing some lift in put skews for the major indexes, this story is one that is still dominated by call trading & open interest. Here we see that P/C volume has increases slightly due to recent spasms, but those are really just daytraders. The core holdings of most traders remains solidly in calls (right chart) at levels not seen since meme-mania in 2021. So far these spasms have not shook out these call holders, but that is the try tinder should a spark appear.

Finishing up with MU into earnings tonight, which is up 265% YTD.. The IV rank is near 100, which is saying something for a stock that has exhibited absurd levels of volatility this year.

Forward implied vol is estimating a ~30 vol point crush for next weeks options, which seems like the main attribute to play here. That can be a challenge here, because AI-stock earnings have seen some blistering pops – often 10-20%. We would assume, too, that vol would come down if the stock starts to correct, which can make put flies or put calendars interesting trades into ER. However, the “stock up, vol up” risk on a beat makes call-based structures a true challenge. We quite frankly see little edge in trying to play the right tail here.
Here is the 7/17 Iron Fly for MU at 300 strikes wide, set to hold a 10 vol point reduction by Friday. As you can see, should the stock move more than $150-180 (~10%) this quickly becomes a loser. Should vol crush a bit quicker/larger than 10 vol points by Friday that PNL range could get a bit better. These names also are quite illiquid, making getting fills in a pinch a painful exercise.

We had to quickly put some sample strikes into this double diagonal, which offers a bit more of a positive PNL range, but looks rather ugly in an extreme right tail move. Obviously this is not investment advice.

What might be a more interesting play for call flies would be a proxy to MU, like SNDK, which has an elevated volatility due to MU earnings. Its call skew is steeper, which may offer better upside calendar/ratio plays.

©2025 TenTen Capital LLC DBA SpotGamma
All TenTen Capital LLC DBA SpotGamma materials, information, and presentations are for educational purposes only and should not be considered specific investment advice nor recommendations. Futures, foreign currency and options trading contains substantial risk and is not for every investor. An investor could potentially lose all or more than the initial investment. Risk capital is money that can be lost without jeopardizing one’s financial security or lifestyle. Only risk capital should be used for trading and only those with sufficient risk capital should consider trading. Past performance is not necessarily indicative of future results. VIEW FULL RISK DISCLOSURE https://spotgamma.com/model-faq/disclaimer/
|
|
/ESU26 |
SPX |
SPY |
NDX |
QQQ |
RUT |
IWM |
|---|---|---|---|---|---|---|---|
|
Reference Price: |
$7430.4 |
$7365 |
$733 |
$29347 |
$713 |
$2975 |
$295 |
|
SG Gamma Index™: |
|
-1.398 |
-0.521 |
|
|
|
|
|
SG Implied 1-Day Move: |
|
0.62% |
0.62% |
|
|
|
|
|
SG Implied 5-Day Move: |
|
1.52% |
|
|
|
|
|
|
SG Implied 1-Day Move High: |
|
After open |
After open |
|
|
|
|
|
SG Implied 1-Day Move Low: |
|
After open |
After open |
|
|
|
|
|
SG Volatility Trigger™: |
$7525.4 |
$7460 |
$740 |
$29460 |
$720 |
$2950 |
$294 |
|
Absolute Gamma Strike: |
$7065.4 |
$7000 |
$720 |
$30000 |
$700 |
$3000 |
$290 |
|
Call Wall: |
$7865.4 |
$7800 |
$800 |
$30325 |
$800 |
$2965 |
$300 |
|
Put Wall: |
$7265.4 |
$7200 |
$735 |
$27000 |
$700 |
$2850 |
$290 |
|
Zero Gamma Level: |
$7443.4 |
$7378 |
$743 |
$29053 |
$728 |
$2990 |
$304 |
|
Key Support & Resistance Strikes |
|---|
|
SPX Levels: [7000, 8000, 7500, 7400] |
|
SPY Levels: [720, 735, 740, 750] |
|
NDX Levels: [30000, 30325, 28000, 27000] |
|
QQQ Levels: [700, 720, 715, 690] |
|
SPX Combos: [(7726,73.48), (7697,93.47), (7675,72.77), (7653,88.91), (7623,78.03), (7601,91.79), (7579,68.80), (7572,85.41), (7557,71.57), (7550,82.97), (7528,84.71), (7498,90.46), (7432,71.77), (7402,96.13), (7388,73.93), (7380,89.75), (7373,86.49), (7365,66.68), (7358,90.96), (7351,93.23), (7343,81.67), (7336,67.05), (7329,96.86), (7321,92.46), (7307,92.51), (7299,97.43), (7292,91.66), (7277,96.35), (7270,83.18), (7262,77.05), (7248,93.44), (7233,71.08), (7226,91.28), (7218,77.71), (7211,66.67), (7203,97.72), (7181,72.23), (7174,78.87), (7152,90.56), (7130,74.20), (7122,78.31), (7100,94.82), (7078,79.63), (7049,73.12), (7027,79.54)] |
|
SPY Combos: [736.94, 757.03, 766.71, 777.13] |
|
NDX Combos: [28790, 28995, 30316, 29406] |
|
QQQ Combos: [737.31, 739.53, 755.03, 741.74] |
|
|
SPX |
SPY |
NDX |
QQQ |
RUT |
IWM |
|---|---|---|---|---|---|---|
|
Gamma Tilt: |
0.864 |
0.592 |
1.249 |
0.674 |
0.824 |
0.581 |
|
Gamma Notional (MM): |
‑$443.245M |
‑$1.334B |
$3.40M |
‑$510.749M |
‑$15.741M |
‑$555.611M |
|
25 Delta Risk Reversal: |
-0.056 |
0.00 |
-0.076 |
-0.055 |
-0.051 |
-0.032 |
|
Call Volume: |
691.263K |
1.579M |
12.015K |
1.148M |
14.895K |
240.51K |
|
Put Volume: |
922.075K |
2.069M |
13.146K |
1.539M |
37.217K |
916.518K |
|
Call Open Interest: |
8.989M |
5.883M |
73.772K |
4.303M |
192.061K |
2.472M |
|
Put Open Interest: |
12.43M |
12.276M |
75.582K |
6.277M |
386.776K |
6.874M |
0 comentarios