
Macro Theme:
Key dates ahead:
- 6/25: CORE PCE
SG Summary:
Update: 6/23: Futures are at fresh lows, with eyes on the MU + PCE catalysts. If those catalysts do not spark buyers, we may see a sharp move lower into the JPM strike area of 7k into 6/30 OPEX. We may elect to buy Friday 7,500 area call flies to hedge against dip buying into these big catalysts.
6/18: Our base case into OPEX is a 1-2% correction (ref 7,475). If traders focus more on higher rates, the major downside support is 7,000 into 6/30 OPEX. To the upside, resistance is at 7,500, with more resistance building into 7,600. We think a sharp rally higher is on hold until more econ data depicts lower inflation/cooler economic data, with the first major econ data on 6/25 (CORE PCE).
Key SG levels for the SPX are:
- Resistance: 7,500
- Pivot: 7,380 (bearish <, bullish >) updated 6/25/26
- Support: 7,400, 7,380, 7,300
Founder’s Note:
ES futures are up 60bps, NQ +200bps, after MU earnings (+17% premarket).
A big PCE print is at 8:30AM EST.
TLDR: We wait for the PCE, then we want to ride the short term trend that sets up out of PCE. Upside targets are 7,500 this week, with 7,600-7,700 for next week. Downside is 7,300, with a door to 7,000 by 6/30.
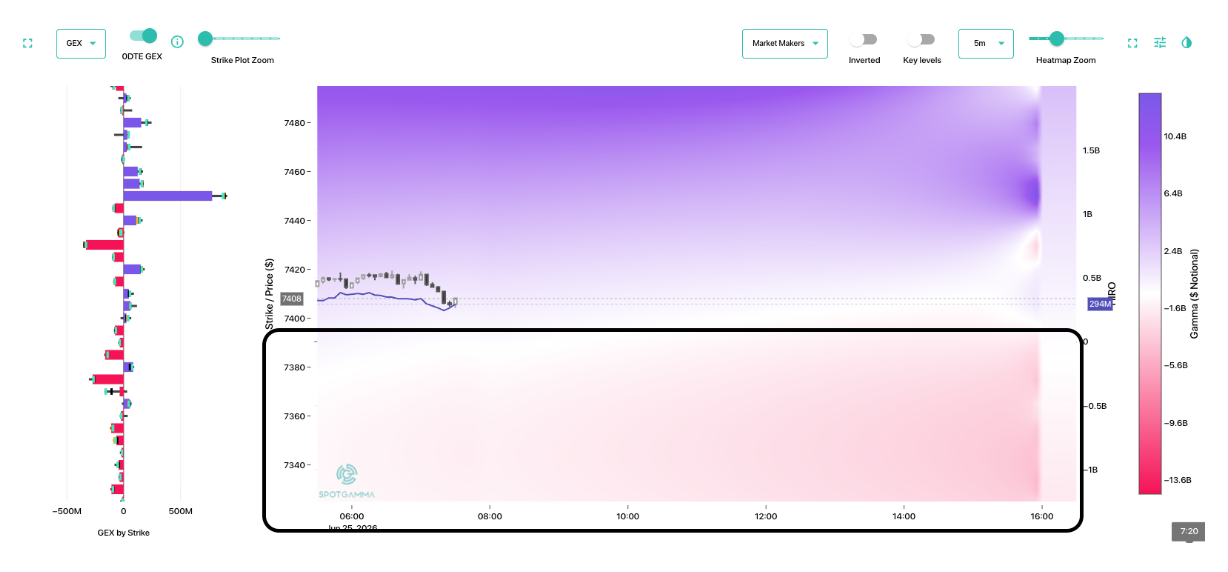
We have moved our Risk Pivot to 7,380, because market makers now hold a negative gamma position below that level (red box). this is a unique construct, as MMs have held positive gamma into lower strikes. If that level breaches we look for first support at 7,300. However a move that low opens the door for continued downside into month end. In that scenario eyes are on the 7k level in SPX into 6/30.
Should we clear PCE without issue, we assume that the equity market will rally more strongly, and SPX will test the 7,500 level in the short term. Following that, we’d have to start looking at retest ATHs into 7,700 as the AI-bubble reflation combines with the possibility of declining rate hike odds.

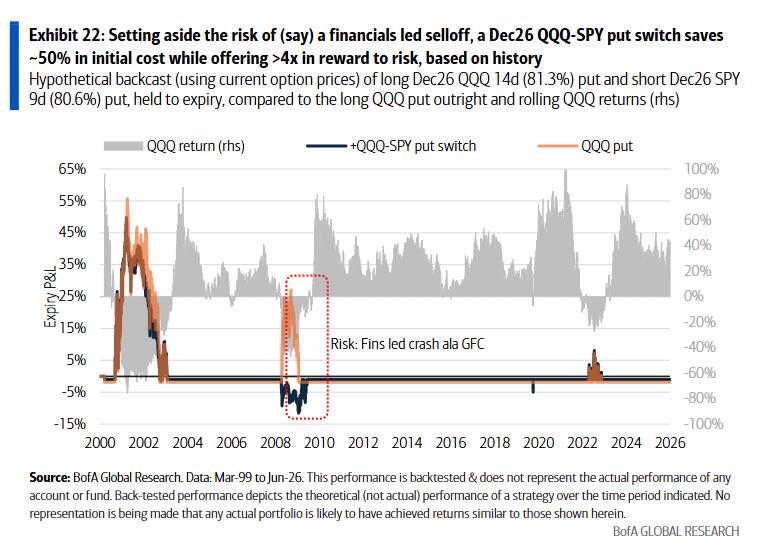
BOFA had a note out yesterday discussing Nasdaq in bubble territory, which implies “high volatility to both tails”. We’re not sure how that is different from how NDX has performed the last 2 months. Regardless, one hedge they discuss is to sell Dec SPY puts to fund long Dec QQQ puts. Were paraphrasing this as the volatility of the NDX has greatly outperformed SPX, and so and risk off situation could be much more violent in NDX over SPY. This is a theme we have discussed at length the last few days and weeks: NDX become an index quite distinguishable from SPX as the outperforms.
To help put the vol divergence into perspective, QQQ has an IV rank up near 100 today, vs SPY at ~37. This is a shockingly high IV rank for QQQ’s, some of which may be attributed to MU earnings last night and CPE this AM. This implies that options are quite expensive in both instruments, but particularly in the QQQs. If rates cool off, this could imply a lot of vol can come for sale which can support stocks. However, any downside may also be met with selling vol because this level of vol is just hard to realize. On this note QQQ has a 1-month RV of ~28% and a 1-month realized of 31% vs SPY at 17 and 18%, respectively.
We will start to worry about this stock up, vol up and a crash/spasm indicator when COR1M goes back <8. That being said, the short term spasms may have thus far been throttled because the QQQ vol is just so high. Its been realizing 2% daily moves and so you can argue that anything less that 2% is “average”.

©2025 TenTen Capital LLC DBA SpotGamma
All TenTen Capital LLC DBA SpotGamma materials, information, and presentations are for educational purposes only and should not be considered specific investment advice nor recommendations. Futures, foreign currency and options trading contains substantial risk and is not for every investor. An investor could potentially lose all or more than the initial investment. Risk capital is money that can be lost without jeopardizing one’s financial security or lifestyle. Only risk capital should be used for trading and only those with sufficient risk capital should consider trading. Past performance is not necessarily indicative of future results. VIEW FULL RISK DISCLOSURE https://spotgamma.com/model-faq/disclaimer/
|
| /ESU26 | SPX | SPY | NDX | QQQ | RUT | IWM |
|---|---|---|---|---|---|---|---|
| Reference Price: | $7424.7 | $7358 | $733 | $29220 | $710 | $2986 | $296 |
| SG Gamma Index™: |
| -2.009 | -0.62 |
|
|
|
|
| SG Implied 1-Day Move: |
| 0.63% | 0.63% |
|
|
|
|
| SG Implied 5-Day Move: |
| 1.52% |
|
|
|
|
|
| SG Implied 1-Day Move High: |
| After open | After open |
|
|
|
|
| SG Implied 1-Day Move Low: |
| After open | After open |
|
|
|
|
| SG Volatility Trigger™: | $7466.7 | $7400 | $740 | $29400 | $717 | $2950 | $296 |
| Absolute Gamma Strike: | $7066.7 | $7000 | $720 | $30325 | $700 | $3000 | $290 |
| Call Wall: | $7866.7 | $7800 | $755 | $30325 | $800 | $2965 | $300 |
| Put Wall: | $7366.7 | $7300 | $720 | $27000 | $700 | $2850 | $290 |
| Zero Gamma Level: | $7436.7 | $7370 | $742 | $28927 | $725 | $3002 | $300 |
| Key Support & Resistance Strikes |
|---|
| SPX Levels: [7000, 8000, 7500, 7400] |
| SPY Levels: [720, 735, 730, 740] |
| NDX Levels: [30325, 28000, 30000, 27000] |
| QQQ Levels: [700, 690, 720, 705] |
| SPX Combos: [(7697,92.20), (7675,68.70), (7653,85.80), (7623,71.64), (7601,90.02), (7579,67.17), (7572,81.23), (7550,82.76), (7527,81.26), (7498,90.65), (7447,74.15), (7402,94.09), (7388,67.49), (7380,86.59), (7373,83.63), (7358,88.90), (7351,94.45), (7344,88.83), (7336,72.42), (7329,90.35), (7321,97.15), (7314,74.00), (7307,89.19), (7299,98.58), (7292,95.14), (7285,70.01), (7277,97.72), (7270,88.40), (7263,93.42), (7248,95.51), (7240,66.51), (7233,73.59), (7226,93.51), (7218,80.57), (7196,98.37), (7189,67.90), (7174,85.97), (7167,70.04), (7152,92.31), (7130,76.60), (7123,85.03), (7101,95.61), (7079,80.93), (7049,78.50), (7027,83.10), (6998,92.51)] |
| SPY Combos: [717.53, 727.07, 730, 724.87] |
| NDX Combos: [28782, 28986, 30330, 27964] |
| QQQ Combos: [700.09, 705.09, 737.2, 715.08] |
|
| SPX | SPY | NDX | QQQ | RUT | IWM |
|---|---|---|---|---|---|---|
| Gamma Tilt: | 0.812 | 0.538 | 1.054 | 0.610 | 0.802 | 0.576 |
| Gamma Notional (MM): | ‑$448.031M | ‑$1.383B | $2.266M | ‑$525.196M | ‑$10.122M | ‑$434.933M |
| 25 Delta Risk Reversal: | -0.06 | -0.037 | -0.08 | -0.061 | -0.054 | -0.036 |
| Call Volume: | 673.401K | 1.617M | 9.241K | 960.215K | 14.00K | 263.058K |
| Put Volume: | 941.498K | 2.126M | 11.469K | 1.335M | 27.319K | 685.078K |
| Call Open Interest: | 9.128M | 5.947M | 75.097K | 4.346M | 199.775K | 2.528M |
| Put Open Interest: | 12.572M | 12.403M | 78.401K | 6.322M | 391.858K | 6.864M |
0 comentarios