
Macro Theme:
Key dates ahead:
- 6/30: JOLTS, Quarterly OPEX
SG Summary:
Update 6/29: The week of 6/29 is starting off on a bullish lean, as SPX is set to open above the Risk Pivot (7,380) into a holiday-shortened week. This short week may allow traders to sell vol, particularly in the QQQ/NDX, which is supportive of stocks. 7,500 remains the big upside target. To the downside, a break of 7,380 implies a test of 7,300.
6/23: Futures are at fresh lows, with eyes on the MU + PCE catalysts. If those catalysts do not spark buyers, we may see a sharp move lower into the JPM strike area of 7k into 6/30 OPEX. We may elect to buy Friday 7,500 area call flies to hedge against dip buying into these big catalysts.
6/18: Our base case into OPEX is a 1-2% correction (ref 7,475). If traders focus more on higher rates, the major downside support is 7,000 into 6/30 OPEX. To the upside, resistance is at 7,500, with more resistance building into 7,600. We think a sharp rally higher is on hold until more econ data depicts lower inflation/cooler economic data, with the first major econ data on 6/25 (CORE PCE).
Key SG levels for the SPX are:
- Resistance: 7,500
- Pivot: 7,380 (bearish <, bullish >) updated 6/25/26
- Support: 7,400, 7,380, 7,300
Founder’s Note:
Futures are 80bps higher, indicating the SPX will open >7,400. This is a recovery of our Risk Pivot.
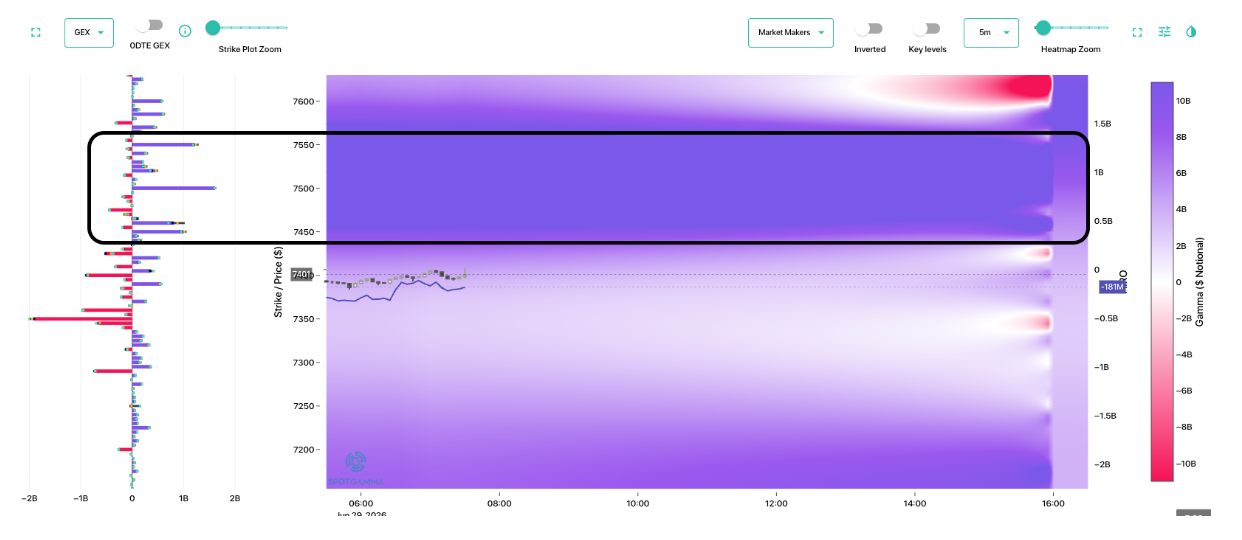
Overall gamma is more positive now that it was yesterday. This reads as traders took the opportunity into weakness last week to sell put options, providing dealers with positive gamma. Its a holiday-shortened week (Friday is closed for July 4th), which allows traders to step up and sell vol. This tips the edge back to bulls. The big upside zone to watch is into 7,500, a region (black box) that is a +95th %’ile gamma zone (not a strike, but a zone). Further, this not a 0DTE block, but mixed expirations which sets this up to be a key resistance area >=today.
To the downside, there is a soft pocket from 7,380 (Risk Pivot) down to 7,300, with support in that area. We’ll need to keep an eye on oil/rates here, as the Iran deal seems under pressure given some flare ups over the weekend.

This short term bullish setup comes into a market that features disjointed volatility markets (see Friday AM note), which are creating spasms. Here we have the COR1M (blue) vs QQQ (red), and you can see that when COR1M goes <8, there are some violent forward moves in the QQQ’s (-7% & -5%).
Those spasms recover quickly, as it seems traders are simply monetizing that volatility by selling puts into weakness which helps stocks recover.

Here is the day over day single stock call change, and you see buy side on net bought calls to open on Friday.

On the put side, they bought them (blue) but they largely took the opportunity to monetize long puts into weakness (orange, stc = sold to close). On net that leaves a pretty slim margin of net long put openings. That’s not really panic.

Rounding this out, we again go back to this chart of QQQ IV (red) vs RV (blue). The QQQ IV is higher than at any point since Covid, which is incredible given its just a few percent from all-time highs. The IV trades for LESS than RV which is very unusual, unless you were coming off of a major market crash. This signals to us that traders are monetizing/selling this high QQQ IV, which should continue to be a supportive feature for tech stocks. It may be why the spasms only last for a day, because the vol is so rich is worth selling.

©2025 TenTen Capital LLC DBA SpotGamma
All TenTen Capital LLC DBA SpotGamma materials, information, and presentations are for educational purposes only and should not be considered specific investment advice nor recommendations. Futures, foreign currency and options trading contains substantial risk and is not for every investor. An investor could potentially lose all or more than the initial investment. Risk capital is money that can be lost without jeopardizing one’s financial security or lifestyle. Only risk capital should be used for trading and only those with sufficient risk capital should consider trading. Past performance is not necessarily indicative of future results. VIEW FULL RISK DISCLOSURE https://spotgamma.com/model-faq/disclaimer/
|
|
/ESU26 |
SPX |
SPY |
NDX |
QQQ |
RUT |
IWM |
|---|---|---|---|---|---|---|---|
|
Reference Price: |
$7421 |
$7354 |
$728 |
$29118 |
$705 |
$3010 |
$299 |
|
SG Gamma Index™: |
|
-0.92 |
-0.505 |
|
|
|
|
|
SG Implied 1-Day Move: |
|
0.62% |
0.62% |
|
|
|
|
|
SG Implied 5-Day Move: |
|
1.53% |
|
|
|
|
|
|
SG Implied 1-Day Move High: |
|
After open |
After open |
|
|
|
|
|
SG Implied 1-Day Move Low: |
|
After open |
After open |
|
|
|
|
|
SG Volatility Trigger™: |
$7467 |
$7400 |
$740 |
$29440 |
$719 |
$2950 |
$297 |
|
Absolute Gamma Strike: |
$7067 |
$7000 |
$735 |
$30325 |
$715 |
$3000 |
$290 |
|
Call Wall: |
$7567 |
$7500 |
$800 |
$30325 |
$800 |
$2965 |
$300 |
|
Put Wall: |
$7367 |
$7300 |
$725 |
$28000 |
$700 |
$2850 |
$290 |
|
Zero Gamma Level: |
$7433 |
$7366 |
$738 |
$28826 |
$720 |
$3025 |
$304 |
|
Key Support & Resistance Strikes |
|---|
|
SPX Levels: [7000, 8000, 7400, 7500] |
|
SPY Levels: [735, 740, 730, 750] |
|
NDX Levels: [30325, 29500, 28000, 30000] |
|
QQQ Levels: [715, 700, 720, 690] |
|
SPX Combos: [(7700,92.25), (7678,74.35), (7648,85.98), (7597,90.30), (7575,77.80), (7567,65.22), (7553,85.98), (7523,90.80), (7508,66.09), (7501,94.49), (7472,83.38), (7457,67.84), (7450,88.07), (7420,65.97), (7398,85.57), (7383,71.44), (7376,71.07), (7361,91.18), (7347,96.22), (7339,71.74), (7332,83.28), (7325,83.64), (7317,91.42), (7303,98.98), (7295,77.65), (7288,94.45), (7280,75.26), (7273,93.39), (7266,86.30), (7258,77.53), (7251,94.24), (7244,68.30), (7236,82.34), (7229,71.51), (7222,88.26), (7214,67.83), (7207,66.98), (7200,97.77), (7192,66.97), (7178,83.87), (7163,81.43), (7148,91.15), (7126,73.96), (7111,73.60), (7097,92.85), (7075,72.64), (7060,75.14), (7053,75.90), (7001,90.84)] |
|
SPY Combos: [727.4, 717.87, 730.34, 725.2] |
|
NDX Combos: [28885, 30312, 29089, 28070] |
|
QQQ Combos: [699.79, 737.75, 714.83, 704.8] |
|
|
SPX |
SPY |
NDX |
QQQ |
RUT |
IWM |
|---|---|---|---|---|---|---|
|
Gamma Tilt: |
0.912 |
0.607 |
1.215 |
0.728 |
0.743 |
0.558 |
|
Gamma Notional (MM): |
‑$317.513M |
‑$1.591B |
$1.651M |
‑$548.911M |
‑$10.856M |
‑$320.092M |
|
25 Delta Risk Reversal: |
-0.049 |
-0.03 |
-0.07 |
0.00 |
-0.053 |
-0.035 |
|
Call Volume: |
673.048K |
1.368M |
10.566K |
874.886K |
16.597K |
170.30K |
|
Put Volume: |
994.415K |
1.959M |
13.988K |
999.425K |
50.813K |
849.174K |
|
Call Open Interest: |
9.316M |
5.912M |
75.941K |
4.429M |
193.795K |
2.493M |
|
Put Open Interest: |
12.633M |
12.09M |
79.862K |
6.165M |
396.627K |
7.033M |
0 comentarios