
Macro Theme:
Key dates ahead:
- 7/1: ISM
- 7/2: NFP
- 7/3: Market Closed (July 4th)
- 7/6: ISM
SG Summary:
Update 7/1: COR1M is back near 5, so we will start adding some small put positions today, and a bit heavier tomorrow. That being said, we think the SPX still has some upside left into the holiday week. Targets: 7,520 is the upside high for 7/1, followed by 7,550-7,600 if NFP tomorrow is quiet. Ultimately we think the bigger play is looking for a solid market correction in the next few weeks as traders are currently at extremes with bullish plays.
6/29: The week of 6/29 is starting off on a bullish lean, as SPX is set to open above the Risk Pivot (7,380) into a holiday-shortened week. This short week may allow traders to sell vol, particularly in the QQQ/NDX, which is supportive of stocks. 7,500 remains the big upside target. To the downside, a break of 7,380 implies a test of 7,300.
Key SG levels for the SPX are:
- Resistance: 7,500, 7,520, 7,550, 7,600
- Pivot: 7,380 (bearish <, bullish >) updated 6/25/26
- Support: 7,400, 7,380, 7,300
Founder’s Note:
Futures are off 10bps ahead of ISM.
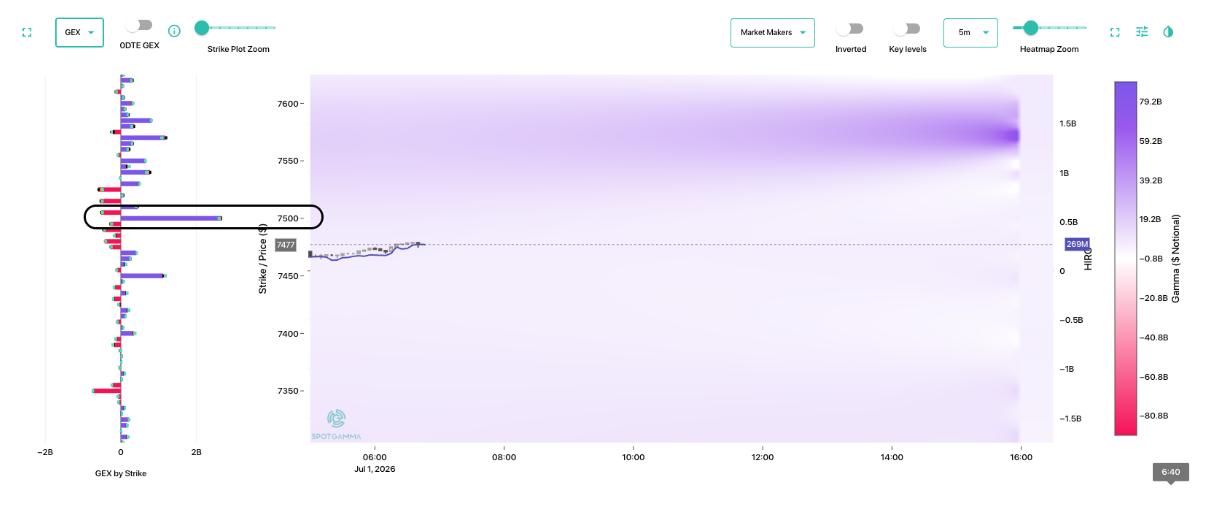
7,500 remains key resistance, due to ~20k long MM calls at that strike. These are not just 0DTE calls, so this should be a key level in through tomorrow. Above that, there is a strip of positive gamma from 7,520 to 7,600. If ISM is benign, we think SPX captures 7,500 today, and plays with resistance at 7,520. If NFP tomorrow is quiet, then we may see a final push into the 7,550-7,600 for tomorrow. This upside is driven by dealer support, and the holiday vol crush.
Support is at 7,400 and we go risk-off <7,380. That being said, we are going to start adding some small put positions on today (pre-NFP), with eyes on a larger allocation into potential highs for tomorrow. Why puts?

Enter: COR1M. Its now at a 5, and those of you who have been here for more than a week know that is our Bat Signal for “spasms ahead”. You can see this via COR1M (bottom candles) vs QQQ (blue). Yes, those nasty very volatile spasms-dips were bought right-back-up, but that does not mean these moves should be ignored.

What’s driving this? SPY IV is sliding lower, as you can see in Compass. Tech IVs, which have moved off of the rich call skews, still maintain very high relative IVs. This gap drives the lows in COR1M. The other thing to note here, is that SPY has a call skew ranking of 85. So we have correlation lows, with people leaning heavily into calls. That is not a bad place to buy put options as they are fairly cheap, and definitely unwanted.
For puts today, we are going to look for some cheap 3-5% OTM put flies that expire next week just in case there is a pre-holiday spasm (unlikely). Into tomorrow we would prefer some put structures >=August in order to limit time decay and give us some time for correlation to (potentially) spasm.
The other thing we have been wanting to think about here is the shorting of vol in some of these high-flying names. If these call skews are reversing, then we could see some “stock down, vol down”.

Shorting vol, or calls in these top tech names was a brutal exercise from April up until June, as positive earnings kept surprising. Now, with no earnings in the short term, we still see names like AMD exhibiting very rich IV as you can see here. The stats band (teal shaded area) are stats from the last 90 days which covers a lot of the huge volatile upside in the stock.

©2025 TenTen Capital LLC DBA SpotGamma
All TenTen Capital LLC DBA SpotGamma materials, information, and presentations are for educational purposes only and should not be considered specific investment advice nor recommendations. Futures, foreign currency and options trading contains substantial risk and is not for every investor. An investor could potentially lose all or more than the initial investment. Risk capital is money that can be lost without jeopardizing one’s financial security or lifestyle. Only risk capital should be used for trading and only those with sufficient risk capital should consider trading. Past performance is not necessarily indicative of future results. VIEW FULL RISK DISCLOSURE https://spotgamma.com/model-faq/disclaimer/
|
|
/ESU26 |
SPX |
SPY |
NDX |
QQQ |
RUT |
IWM |
|---|---|---|---|---|---|---|---|
|
Reference Price: |
$7559.1 |
$7499 |
$746 |
$30276 |
$735 |
$3024 |
$300 |
|
SG Gamma Index™: |
|
2.826 |
0.005 |
|
|
|
|
|
SG Implied 1-Day Move: |
|
0.65% |
0.65% |
|
|
|
|
|
SG Implied 5-Day Move: |
|
1.53% |
|
|
|
|
|
|
SG Implied 1-Day Move High: |
|
After open |
After open |
|
|
|
|
|
SG Implied 1-Day Move Low: |
|
After open |
After open |
|
|
|
|
|
SG Volatility Trigger™: |
$7505.1 |
$7445 |
$746 |
$29970 |
$728 |
$2950 |
$298 |
|
Absolute Gamma Strike: |
$7060.1 |
$7000 |
$750 |
$30325 |
$740 |
$3000 |
$290 |
|
Call Wall: |
$7610.1 |
$7550 |
$755 |
$30325 |
$740 |
$3050 |
$300 |
|
Put Wall: |
$7360.1 |
$7300 |
$740 |
$28000 |
$700 |
$2885 |
$290 |
|
Zero Gamma Level: |
$7459.1 |
$7399 |
$745 |
$29303 |
$728 |
$3017 |
$302 |
|
Key Support & Resistance Strikes |
|---|
|
SPX Levels: [7000, 8000, 7500, 7600] |
|
SPY Levels: [750, 740, 745, 755] |
|
NDX Levels: [30325, 30000, 31000, 30500] |
|
QQQ Levels: [740, 730, 720, 735] |
|
SPX Combos: [(7852,84.31), (7822,76.63), (7799,96.68), (7777,72.16), (7747,90.92), (7739,65.26), (7732,70.27), (7724,77.91), (7702,97.61), (7672,89.37), (7657,75.12), (7649,93.66), (7642,84.17), (7634,76.06), (7627,92.33), (7619,68.47), (7612,85.78), (7597,98.28), (7589,81.98), (7582,96.64), (7574,95.60), (7567,97.67), (7559,85.93), (7552,99.36), (7544,93.17), (7537,98.46), (7529,90.71), (7522,98.99), (7514,88.91), (7507,94.20), (7499,98.20), (7492,82.47), (7432,86.54), (7424,84.25), (7402,92.52), (7387,86.87), (7372,74.42), (7349,90.07), (7342,85.41), (7334,66.70), (7327,71.33), (7297,94.52), (7289,78.10), (7282,77.96), (7274,79.30), (7252,83.99), (7237,75.34), (7222,70.20), (7199,92.17), (7177,70.87), (7147,84.18), (7132,68.14)] |
|
SPY Combos: [746.79, 751.97, 726.78, 749.01] |
|
NDX Combos: [30337, 30458, 31003, 31487] |
|
QQQ Combos: [737.06, 700.14, 715.34, 729.82] |
|
|
SPX |
SPY |
NDX |
QQQ |
RUT |
IWM |
|---|---|---|---|---|---|---|
|
Gamma Tilt: |
1.298 |
1.004 |
2.028 |
1.15 |
0.983 |
0.752 |
|
Gamma Notional (MM): |
$770.108M |
$128.554M |
$13.995M |
$203.105M |
‑$2.897M |
‑$242.787M |
|
25 Delta Risk Reversal: |
-0.042 |
0.00 |
-0.067 |
0.00 |
-0.045 |
-0.025 |
|
Call Volume: |
756.375K |
1.62M |
20.718K |
1.053M |
19.575K |
210.182K |
|
Put Volume: |
1.105M |
2.199M |
14.971K |
1.183M |
29.637K |
515.46K |
|
Call Open Interest: |
9.322M |
5.915M |
79.487K |
4.355M |
193.799K |
2.472M |
|
Put Open Interest: |
12.492M |
11.753M |
79.155K |
5.972M |
396.878K |
6.73M |
0 comentarios