
Macro Theme:
Key dates ahead:
- 7/29: FOMC, MSFT/META ER
- 7/30: GDP, PCE, AAPL/AMZN ER
SG Summary:
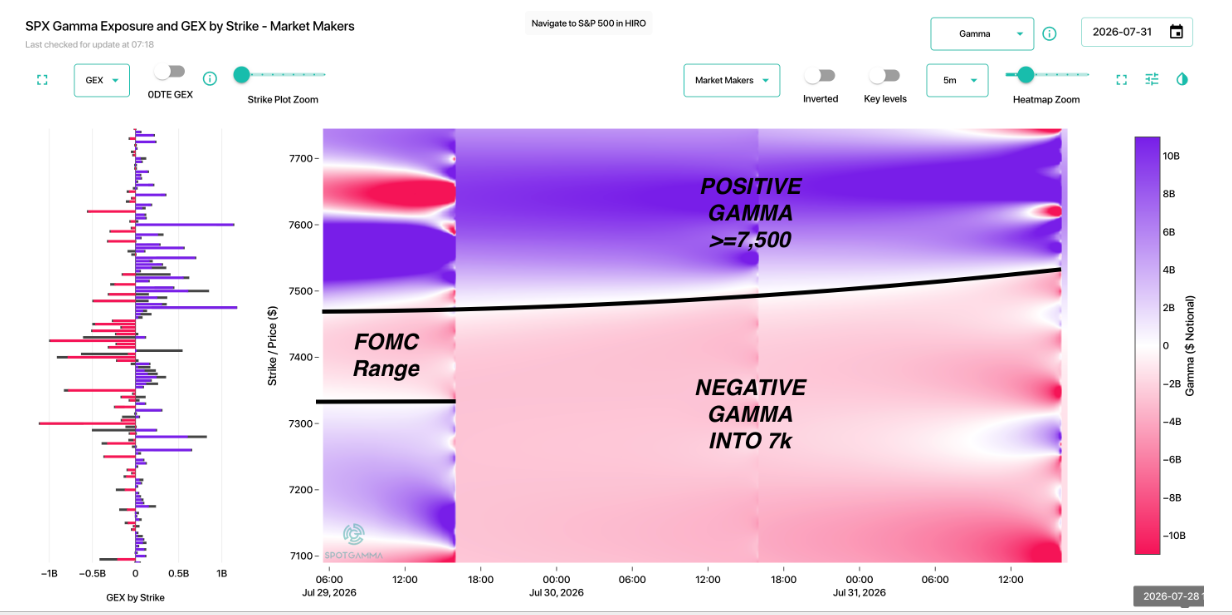
Update 7/29: Into FOMC & Megacap ERs market stability comes with a move >=7,500. To the downside, there is a large pocket of negative gamma down into 7,000. Given this, we outlined a short dated SPX put flies as a trade in our Wed AM note.
7/27: Due to fresh Iran/US peace talks (CL -7%), we look to play a short dated rally in the QQQs into 705 on Tuesday 7/28. We will be using call flies to express this upside view. This is a short term trade, only, and is not valid >7/30 due to FOMC + Megacap earnings. We note that negative gamma in the SPX has built up <7,450, and so we would be risk-off if the SPX breaks back <7,450.
7/22: VIX expiration is today. On the open of 7/22 the SPX remains right on the Risk Pivot, with mild positive gamma below. VIX Exp may “free up” volatility, and so we remain risk-off if SPX is <7,480. COR1M also remains in our “red alert” zone <8. The market really needs big earnings to compensation for growing macro risks (oil +85 and 10Y +4.6%). Given these risks, we are going to be adding to short dated, cheap, OTM index put flies (SPX/QQQ).
Key SG levels for the SPX are:
- Resistance: 7,500, 7,525, 7,550, 7,600
- Pivot: 7,450 (bearish <, bullish >) updated 7/27/26
- Support: 7,400, 7,300
Founder’s Note:
Futures are up 30bps, with CL 4.8%.
FOMC, MSFT & META ER on tap for today.
Today’s 0DTE SPX straddle is just $54/72bps (ref 7,445), given this is essentially pricing in the range for post-FOMC (little often happens before 2-2:30PM on FOMC day). However, tomorrow’s straddle is $80/107bps which shows the impact of both FOMC and MSFT/META ER after the close.
The SPX map for today is quite clear: stability comes with a move back into positive gamma >7,500.
Below 7,480 the SPX holds negative gamma, which shows support today at ~7,325. Past today, the negative gamma persists into the 7,000 strike. Given this, an hawkish tilt from Warsh today could push selling into this negative gamma positioning, which invokes dealer selling below. This is the type of positioning which can help make for nasty downside moves.

Our lens here is that the best case is “nothing done” from Warsh, which is a sigh of relief for markets more than a bullish impulse. Megacap earnings, the semi/memory trade, and oil prices may be more relevant ex-FOMC.
Odds favor no rate change today (65% per FedWatch), there are some out there calling for 25 or even 50bps of hiking today. Certainly something along those lines, or more hawkish rhetoric may finally tip the SPX scales lower – in line to the downside which has been seen in the Nasdaq.
Looking at the 0DTE straddle vs today’s key levels shows that ~70bps higher from current SPX levels (ie 7,445) puts the market right near 7,500 positive gamma resistance. Upside is fairly valued.
To the downside, we currently see negative gamma to ~7,325, which is more than 1% lower from the currently indicated SPX price (7,445). Arguably the market isn’t pricing in potential ranges downside like gamma is.
Because we see this large pocket of negative gamma over the next few sessions, we are keen to add a downside play. Vols (i.e. options) are unambiguously expensive not just because of the FOMC premium, but due to tech selling and geopolitical premiums. Given this, we turn to put structures to find relatively cheap hedges vs outright puts. Given that we see negative gamma down into 7k (-5% from current SPX levels), the potential for market downside is arguably sharper than the market is pricing in.
Here we have the 7200 x 7000 x 6800 SPX put fly for 7/31. These are example strikes, and not an explicit trade recommendation.
The goal here is to essentially reduce the cost of our long put, the 7200, by selling puts at levels where the negative gamma subsides (7k in this example).

What this gives us is a structure that is now mildy negative delta – but if the market does jump lower the structure should accrue negative deltas rather quickly as the 7200 put gains in value much more rapidly than the 7000s. You can see this in the PNL projection for tomorrow, which shows gains in this structure if the SPX moves down into 7,300 or lower. If the SPX did have a major decline into Friday, 7/31, this structure has a massive payout.

One last note on these: we often like to trade them in SPY but carry many spreads vs smaller SPX lots. Then, if some early market downside triggers, we sell a tranche of spreads to cover our initial costs and then let the rest ride.
Lastly, on MSFT/META ER tonight, which are both pricing in a 7% move: The IV Rank is massively high for these names (+70%), and there is a decisive call skew to both of them. Said another way – it looks like traders are hedging a dead-cat-bounce a bit more vs a sharp drop. Both of these names have been underperforming the other megacaps, and so this upside hedge may make a bit of sense. Given the IV Rank is so elevated, it may make some sense to play some short volatility strategies like calendars, condors, etc.
The trouble here is you are mixing in a lot of macro data (FOMC, PCE tomorrow AM) with these earnings, and so we recommend traders wait for after the FOMC to enter ER plays.

©2025 TenTen Capital LLC DBA SpotGamma
All TenTen Capital LLC DBA SpotGamma materials, information, and presentations are for educational purposes only and should not be considered specific investment advice nor recommendations. Futures, foreign currency and options trading contains substantial risk and is not for every investor. An investor could potentially lose all or more than the initial investment. Risk capital is money that can be lost without jeopardizing one’s financial security or lifestyle. Only risk capital should be used for trading and only those with sufficient risk capital should consider trading. Past performance is not necessarily indicative of future results. VIEW FULL RISK DISCLOSURE https://spotgamma.com/model-faq/disclaimer/
|
|
/ESU26 |
SPX |
SPY |
NDX |
QQQ |
RUT |
IWM |
|---|---|---|---|---|---|---|---|
|
Reference Price: |
$7461.45 |
$7428 |
$740 |
$27763 |
$675 |
$2953 |
$293 |
|
SG Gamma Index™: |
|
-0.076 |
-0.573 |
|
|
|
|
|
SG Implied 1-Day Move: |
|
0.63% |
0.63% |
|
|
|
|
|
SG Implied 5-Day Move: |
|
1.62% |
|
|
|
|
|
|
SG Implied 1-Day Move High: |
|
$7470.32 |
$744.63 |
|
|
|
|
|
SG Implied 1-Day Move Low: |
|
$7376.78 |
$735.31 |
|
|
|
|
|
SG Volatility Trigger™: |
$7498.45 |
$7465 |
$746 |
$28000 |
$705 |
$2960 |
$294 |
|
Absolute Gamma Strike: |
$7033.45 |
$7000 |
$750 |
$28000 |
$700 |
$3000 |
$290 |
|
Call Wall: |
$7733.45 |
$7700 |
$755 |
$28550 |
$685 |
$2970 |
$300 |
|
Put Wall: |
$7333.45 |
$7300 |
$740 |
$27000 |
$660 |
$2880 |
$290 |
|
Zero Gamma Level: |
$7418.45 |
$7385 |
$744 |
$28112 |
$694 |
$3014 |
$304 |
|
Key Support & Resistance Strikes |
|---|
|
SPX Levels: [7000, 7500, 8000, 7600] |
|
SPY Levels: [750, 740, 730, 745] |
|
NDX Levels: [28000, 27000, 28550, 29000] |
|
QQQ Levels: [700, 680, 660, 690] |
|
SPX Combos: [(7778,65.74), (7748,89.01), (7733,65.61), (7726,73.21), (7719,66.29), (7704,95.73), (7674,81.10), (7652,95.47), (7637,67.90), (7622,92.88), (7607,76.46), (7600,95.58), (7592,81.49), (7577,94.07), (7570,82.94), (7562,89.25), (7548,94.25), (7540,75.38), (7533,79.81), (7525,79.56), (7518,81.58), (7510,72.14), (7503,93.34), (7488,80.65), (7451,88.86), (7421,94.60), (7406,68.15), (7399,96.39), (7392,83.94), (7384,72.73), (7377,90.39), (7369,91.83), (7362,78.73), (7354,76.50), (7347,94.51), (7340,77.67), (7332,77.45), (7325,79.45), (7317,92.15), (7310,70.40), (7302,98.98), (7288,84.61), (7280,81.29), (7273,95.01), (7258,82.67), (7250,93.41), (7243,70.13), (7228,87.50), (7221,85.95), (7198,96.33), (7176,77.41), (7169,78.89), (7146,93.27), (7124,65.57), (7117,78.08), (7102,90.32), (7087,64.96), (7072,73.98)] |
|
SPY Combos: [727.93, 737.54, 717.59, 732.37] |
|
NDX Combos: [27125, 27957, 27014, 28541] |
|
QQQ Combos: [680.01, 660.23, 694.34, 681.38] |
|
|
SPX |
SPY |
NDX |
QQQ |
RUT |
IWM |
|---|---|---|---|---|---|---|
|
Gamma Tilt: |
0.993 |
0.609 |
0.785 |
0.590 |
0.503 |
0.456 |
|
Gamma Notional (MM): |
‑$109.186M |
‑$1.429B |
‑$6.575M |
‑$829.538M |
‑$66.077M |
‑$959.888M |
|
25 Delta Risk Reversal: |
-0.062 |
-0.041 |
-0.071 |
0.00 |
-0.059 |
-0.044 |
|
Call Volume: |
695.056K |
1.439M |
9.525K |
1.473M |
13.904K |
199.707K |
|
Put Volume: |
892.149K |
1.851M |
12.584K |
1.509M |
19.869K |
583.719K |
|
Call Open Interest: |
9.482M |
6.126M |
85.703K |
5.108M |
226.476K |
2.63M |
|
Put Open Interest: |
12.749M |
11.993M |
90.172K |
6.524M |
453.187K |
7.011M |
0 comentarios