
Macro Theme:
Key dates ahead:
- 8/4: JOLTS
- 8/5: ISM
- 8/7: NFP
- 8/12: CPI
SG Summary:
Update 8/30: COR1M (correlation) is back to our <8 “we want to hedge” levels. If the AI-trade indeed has renewed legs, and the 8/3 Iran deal is material, then this is likely a bull train that persists into OPEX (8/21), and so we want to maintain equity longs while above the Risk Pivot (7,480). Simultaneously, there are several things that could trigger a vol spasm here, and so we want to start dipping our toe into >=1-month SPX/QQQ put spread hedges. If SPX breaks <Risk Pivot then we will look to press shorts.
Key SG levels for the SPX are:
- Resistance: 7,620, 7,650
- Pivot: 7,480 (bearish <, bullish >) updated 8/3/26
- Support: 7,600, 7,550, 7,500, 7,480
Founder’s Note:
ES futures +15bps, NQ futures +70bps.
JOLTS at 8:30 AM EST.
The S&P is indicated to open just under its all time high of 7,621.
TLDR: SPX vol is in the gutter and we caution against selling short dated SPX options. Traders are poised to chase single stocks, as they view this as an equity risk-free environment. We’re not going to argue with this view until/unless the SPX breaks <Risk-Pivot (7,480).
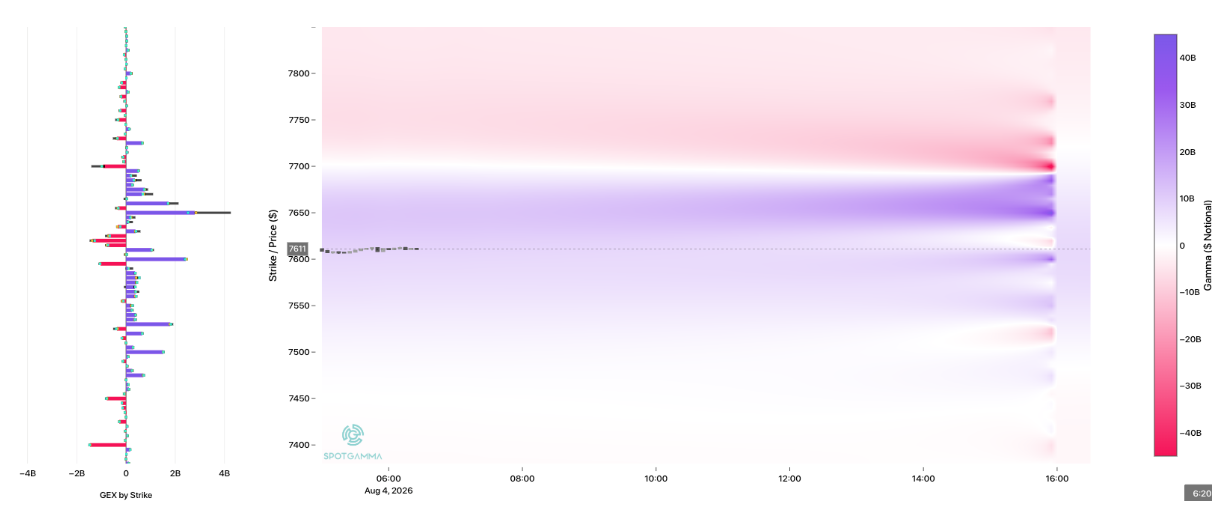
SPX positive gamma is back in control, which should help to throttle volatility today. Resistance is at 7,650. Support is at 7,600 & 7,550. Index vols continue to come in, which adds a vanna-based tailwind for stocks.

Yesterday was an upside “sneak attack”. The market was pricing in X bps of movement, and we saw big 0DTE calls sold (MM long) in the 7,570s area. As the market rallied strongly, those calls we rolled higher to 7,590s, then again to 7,610 (and those 7,610s were closed by EOD too). Typically with the “seek and destroy” the positions stay in place even if the SPX tags the large OI strikes. We think the rolling was a fear-based “oh no” response, as the market ripped higher on the back of very strong HIRO readings (see PM note). These sellers, like the market, were not pricing in that much upside volatility.
Iran appears to be the main trigger of this risk-on move – and it was a move which happened without the leading DRAM/SMH sectors (1.5%/0.9% vs QQQ +1.76% & MAGS 3.7%).
Incredible (or hilariously?) after yesterday’s blowout move, today the 0DTE straddle is just $25.50/33 bps (ref 7,610) – which is as quiet as you will ever see. This is a massive adjustment for SPX expectations, as 5-day SPX realized vol is 20% (yesterday was a ~24% annualized vol move). Now, based on the straddle, we’re poised to realize a 6% IV?!?!. We are not here to say “short this market”, but this is suggesting that shorting SPX vol is a tough choice because the risk vs reward seems terrible.

The other impact of this is that correlation (ex COR1M) is likely to get slammed lower as SPX vol tanks, and traders are keen to pile into single stock bets. Further, dispersion is high – and if you were curious what that looks like then check out the Compass below. It shows top stocks are spread out all over the spectrum of the map as traders chase various themes (mags vs software vs semis vs cyclicals vs financials…)
While we don’t want to fight the bullish impulse here, its clear that with vols the way they are something will at some point spasm to the downside. The big money question will be catching that spasm before it happens.

Currently the SPX shows elevated forward IV’s for Friday NFP, then again next week into a bunch of key economic data (CPI, PPI) – Iran aside these dates appear to be the first shot to shake things up.

Lastly – SPCX earnings.
The market is implying a ~14% move. We’re looking for a ~40 vol point contraction after earnings (huge). Below is the fixed strike matrix set to skew premium and you can see the bulk of the skew premium is to the upside. This is because traders have pumped the call skew with the stock at post-IPO lows. This premium is quite rich, while EquityHub shows dealers mainly long calls. Its going to be hard for SPCX to earn upside into this rich vol…but tech stocks were doing it in April.
There is also a lot of attention on the huge 8/7 330 strike open interest: we see that banks hold a lot of long contracts there with customers/mms short. We actually think this is a bank long call hedge for risk margin purposes – possibly against some type of short exposure they maintain in the stock.

©2025 TenTen Capital LLC DBA SpotGamma
All TenTen Capital LLC DBA SpotGamma materials, information, and presentations are for educational purposes only and should not be considered specific investment advice nor recommendations. Futures, foreign currency and options trading contains substantial risk and is not for every investor. An investor could potentially lose all or more than the initial investment. Risk capital is money that can be lost without jeopardizing one’s financial security or lifestyle. Only risk capital should be used for trading and only those with sufficient risk capital should consider trading. Past performance is not necessarily indicative of future results. VIEW FULL RISK DISCLOSURE https://spotgamma.com/model-faq/disclaimer/
|
|
/ESU26 |
SPX |
SPY |
NDX |
QQQ |
RUT |
IWM |
|---|---|---|---|---|---|---|---|
|
Reference Price: |
$7627.15 |
$7600 |
$757 |
$28776 |
$700 |
$2981 |
$296 |
|
SG Gamma Index™: |
|
5.612 |
0.064 |
|
|
|
|
|
SG Implied 1-Day Move: |
|
0.69% |
0.69% |
|
|
|
|
|
SG Implied 5-Day Move: |
|
1.56% |
|
|
|
|
|
|
SG Implied 1-Day Move High: |
|
$7684.31 |
$765.83 |
|
|
|
|
|
SG Implied 1-Day Move Low: |
|
$7578.99 |
$755.33 |
|
|
|
|
|
SG Volatility Trigger™: |
$7522.15 |
$7495 |
$757 |
$28530 |
$698 |
$2960 |
$295 |
|
Absolute Gamma Strike: |
$8027.15 |
$8000 |
$750 |
$29000 |
$700 |
$3000 |
$290 |
|
Call Wall: |
$7677.15 |
$7650 |
$760 |
$28550 |
$710 |
$2970 |
$300 |
|
Put Wall: |
$7427.15 |
$7400 |
$750 |
$28000 |
$660 |
$2850 |
$285 |
|
Zero Gamma Level: |
$7470.15 |
$7443 |
$756 |
$28274 |
$698 |
$2974 |
$300 |
|
Key Support & Resistance Strikes |
|---|
|
SPX Levels: [8000, 7000, 7600, 7500] |
|
SPY Levels: [750, 755, 760, 758] |
|
NDX Levels: [29000, 28550, 28000, 28900] |
|
QQQ Levels: [700, 690, 710, 680] |
|
SPX Combos: [(7973,69.99), (7950,89.82), (7927,79.18), (7897,98.35), (7874,81.16), (7851,91.51), (7829,81.46), (7821,75.72), (7798,98.32), (7775,93.56), (7760,65.79), (7753,97.38), (7737,71.14), (7730,75.88), (7722,97.42), (7707,83.31), (7699,99.45), (7692,92.07), (7684,72.48), (7677,99.06), (7669,88.65), (7661,97.26), (7654,99.95), (7646,92.52), (7639,99.26), (7631,99.55), (7623,99.77), (7616,94.54), (7608,99.13), (7600,99.40), (7593,98.57), (7585,90.93), (7578,96.75), (7570,70.27), (7547,96.96), (7532,81.96), (7524,76.98), (7471,82.50), (7464,66.51), (7448,87.33), (7426,83.65), (7403,96.02), (7372,85.39), (7350,91.96), (7319,68.88), (7296,95.43), (7274,80.67), (7251,86.40), (7228,70.92)] |
|
SPY Combos: [753.01, 755.25, 750.77, 758.24] |
|
NDX Combos: [28547, 27942, 29180, 28000] |
|
QQQ Combos: [694.87, 659.78, 679.73, 681.11] |
|
|
SPX |
SPY |
NDX |
QQQ |
RUT |
IWM |
|---|---|---|---|---|---|---|
|
Gamma Tilt: |
1.527 |
1.045 |
1.419 |
1.002 |
0.848 |
0.634 |
|
Gamma Notional (MM): |
$1.456B |
$322.459M |
$9.301M |
$59.369M |
‑$17.992M |
‑$553.528M |
|
25 Delta Risk Reversal: |
-0.036 |
0.00 |
-0.047 |
0.00 |
-0.04 |
0.00 |
|
Call Volume: |
1.123M |
2.346M |
8.789K |
1.076M |
25.507K |
292.144K |
|
Put Volume: |
1.142M |
3.518M |
10.634K |
1.125M |
41.849K |
818.493K |
|
Call Open Interest: |
9.654M |
6.203M |
83.723K |
5.002M |
234.744K |
2.758M |
|
Put Open Interest: |
12.955M |
13.983M |
93.41K |
6.24M |
450.677K |
7.283M |
0 comentarios