
Macro Theme:
Key dates ahead:
- 9/2: JOLTS/ISM
- 9/3: Jobs/ISM PMI
- 9/4: NFP
- 9/7: Labor Day holiday
- 9/11: CPI
- 9/18: OPEX
SG Summary:
Update 8/31: JHole has left us with higher probabilities of a Sep hike. Traders pushed the SPX back to 7,700, but also sold options after Warsh’s speech. Through IV’s we also now see a greater focus upcoming macro data like NFP, ISM, CPI, etc.
Given this, we have to back away from the view of an equity market set to trend higher into Sep OPEX, and instead look to more tactical mean reversion trading (vs positioning for upside trend). The Risk Pivot remains at 7,650.
8/27: We are looking to enter a “barbell” strategy into JHOLE, tomorrow: Long a small lot of cheap “just in case” OTM SPX put flies for Monday in case of a Warsh market-upset vs a starter lot of Sep SPX 8,000 area call structures. Should Warsh pass as a non-event we would add to those 8k structures with the view that vol will crush, and tech will continue higher into Sep OPEX.
Key SG levels for the SPX are:
- Resistance: 7,720, 7,750, 7,800
- Pivot: 7,650 (bearish <, bullish >) updated 8/20/26
- Support: 7,700, 7,650, 7,600
Founder’s Note:
Futures are 20 bps lower today – the last trading day of August.
Oil is +3.5% as tensions in Iran ticked higher.
The big dynamic is the market is now pricing in a 60% probability of a Sep hike vs 40% pre-JHole.
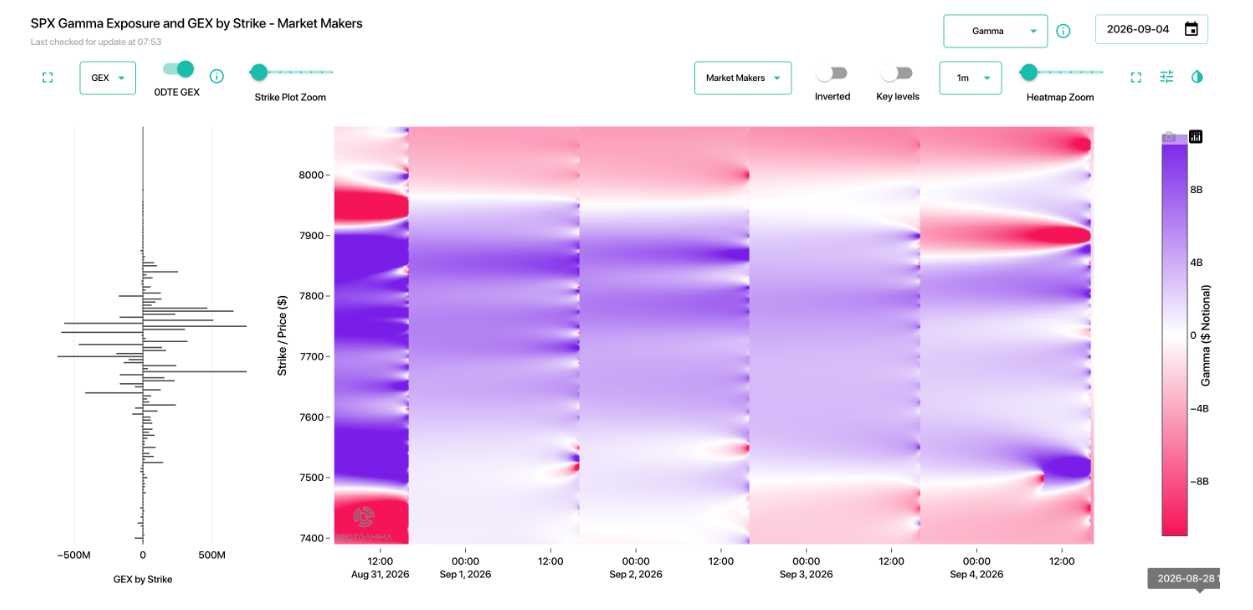
On Friday, SPX gamma for this week was projected to be negative <=7,700. What we see is that is now positive, suggesting traders sold options post-Warsh. This appears to be the options market monetizing a small uptick in volatility, with seemingly no concern about a rate-induced selloff.
Our idea into NVDA/Jackson Hole was that the equity market would break into a new trend into Sep OPEX. Now we see a market that has resorted back to 7,700, and is much more focused on forward macro prints like Friday NFP, mid-sep CPI, etc. Given this, we will look to play mean reversion on the index side, buying dips & selling rips until/unless the SPX breaks <7,650 Risk Pivot – at which point we’d add to shorts. We will also remove any long Sep index call positions in favor of shorter term more tactical trades.

The “likely hiking” situation has shoved traders back into puts for bonds, as seen in IEF, LQD, and to a lesser extent TLT. We also so XLF shift from a call-sided stance into ATHs, to a more neutral stance. The lift in put skew in IEF/LQD vs TLT is interesting (and could be short term noise) as Bessent was working quite hard to jawbone the long end treasury rates lower.

There are a few key earnings this week including DELL (Tues) & AVGO (Wed). We still see traders as leaning towards calls into these top stocks, as you can see in the plots below. Each dot is a top-25 component of the S&P (left) & Nasdaq (right). You can see most of the components are at the top left, which is a low IV, call skewed expectation.

What is interesting about this moment is that NVDA had great earnings, pushing the stock to 230 on Friday before is closed down to 218. If AVGO and DELL inspire similar confidence, could we start to see a re-emergence of the tech trade while the S&P components remain stuck in a rate-quagmire?
Here is the VXN (Nasdaq VIX) – VIX, and you can see there was a massive divergence between the two as tech stocks ripped higher into June, and then collapsed in July. The VXN/VIX relationship is now “back to the mean”, but remember that the Nasdaq has fundamentally changed its constituency for names like SPCX, and upcoming Anthropic IPO’s (rumored for Oct).

©2025 TenTen Capital LLC DBA SpotGamma
All TenTen Capital LLC DBA SpotGamma materials, information, and presentations are for educational purposes only and should not be considered specific investment advice nor recommendations. Futures, foreign currency and options trading contains substantial risk and is not for every investor. An investor could potentially lose all or more than the initial investment. Risk capital is money that can be lost without jeopardizing one’s financial security or lifestyle. Only risk capital should be used for trading and only those with sufficient risk capital should consider trading. Past performance is not necessarily indicative of future results. VIEW FULL RISK DISCLOSURE https://spotgamma.com/model-faq/disclaimer/
|
|
/ESU26 |
SPX |
SPY |
NDX |
QQQ |
RUT |
IWM |
|---|---|---|---|---|---|---|---|
|
Reference Price: |
$7721.75 |
$7711 |
$769 |
$29433 |
$716 |
$2972 |
$295 |
|
SG Gamma Index™: |
|
1.927 |
-0.217 |
|
|
|
|
|
SG Implied 1-Day Move: |
|
0.60% |
0.60% |
|
|
|
|
|
SG Implied 5-Day Move: |
|
1.39% |
|
|
|
|
|
|
SG Implied 1-Day Move High: |
|
After open |
After open |
|
|
|
|
|
SG Implied 1-Day Move Low: |
|
After open |
After open |
|
|
|
|
|
SG Volatility Trigger™: |
$7720.75 |
$7710 |
$770 |
$29270 |
$716 |
$3000 |
$299 |
|
Absolute Gamma Strike: |
$8010.75 |
$8000 |
$770 |
$29500 |
$700 |
$3000 |
$290 |
|
Call Wall: |
$7810.75 |
$7800 |
$780 |
$29275 |
$730 |
$3005 |
$310 |
|
Put Wall: |
$7510.75 |
$7500 |
$765 |
$29600 |
$700 |
$2960 |
$290 |
|
Zero Gamma Level: |
$7677.75 |
$7667 |
$767 |
$29138 |
$715 |
$3055 |
$304 |
|
Key Support & Resistance Strikes |
|---|
|
SPX Levels: [8000, 7700, 7000, 7600] |
|
SPY Levels: [770, 765, 760, 775] |
|
NDX Levels: [29500, 29275, 29600, 29000] |
|
QQQ Levels: [700, 720, 710, 715] |
|
SPX Combos: [(8090,71.82), (8067,83.30), (8059,67.50), (8051,94.82), (8043,88.35), (8028,82.93), (8020,81.76), (8013,67.05), (7997,97.98), (7989,66.04), (7974,77.39), (7951,93.99), (7928,86.07), (7920,79.55), (7912,70.67), (7897,99.33), (7889,79.63), (7881,70.18), (7874,93.54), (7866,69.82), (7858,82.37), (7851,97.84), (7843,72.47), (7827,94.45), (7820,91.52), (7812,90.94), (7797,99.64), (7789,83.07), (7781,94.31), (7773,94.54), (7766,85.09), (7758,88.37), (7750,97.61), (7743,90.89), (7735,84.51), (7727,85.46), (7719,66.84), (7696,89.63), (7689,88.90), (7681,78.10), (7673,90.22), (7665,92.47), (7658,76.73), (7650,89.77), (7642,84.12), (7635,65.49), (7627,89.42), (7619,91.14), (7612,77.47), (7604,92.71), (7588,76.69), (7573,88.43), (7565,74.36), (7558,67.10), (7550,94.50), (7527,85.54), (7519,86.38), (7511,77.23), (7504,97.89), (7473,77.32), (7450,86.40), (7426,73.64), (7419,70.68), (7403,92.43), (7349,77.72)] |
|
SPY Combos: [777.98, 788, 780.29, 772.58] |
|
NDX Combos: [29286, 28756, 29993, 29639] |
|
QQQ Combos: [729.71, 723.94, 717.45, 712.41] |
|
|
SPX |
SPY |
NDX |
QQQ |
RUT |
IWM |
|---|---|---|---|---|---|---|
|
Gamma Tilt: |
1.143 |
0.834 |
1.246 |
0.888 |
0.421 |
0.427 |
|
Gamma Notional (MM): |
$502.475M |
‑$405.851M |
$7.658M |
‑$140.221M |
‑$135.101M |
‑$1.289B |
|
25 Delta Risk Reversal: |
-0.034 |
-0.031 |
-0.039 |
-0.031 |
-0.039 |
0.00 |
|
Call Volume: |
698.391K |
1.599M |
7.837K |
881.793K |
17.506K |
263.57K |
|
Put Volume: |
970.884K |
1.808M |
10.959K |
1.188M |
65.548K |
1.111M |
|
Call Open Interest: |
9.628M |
5.732M |
85.14K |
5.231M |
245.361K |
2.889M |
|
Put Open Interest: |
13.622M |
14.015M |
101.269K |
6.68M |
515.355K |
7.193M |
0 comentarios