
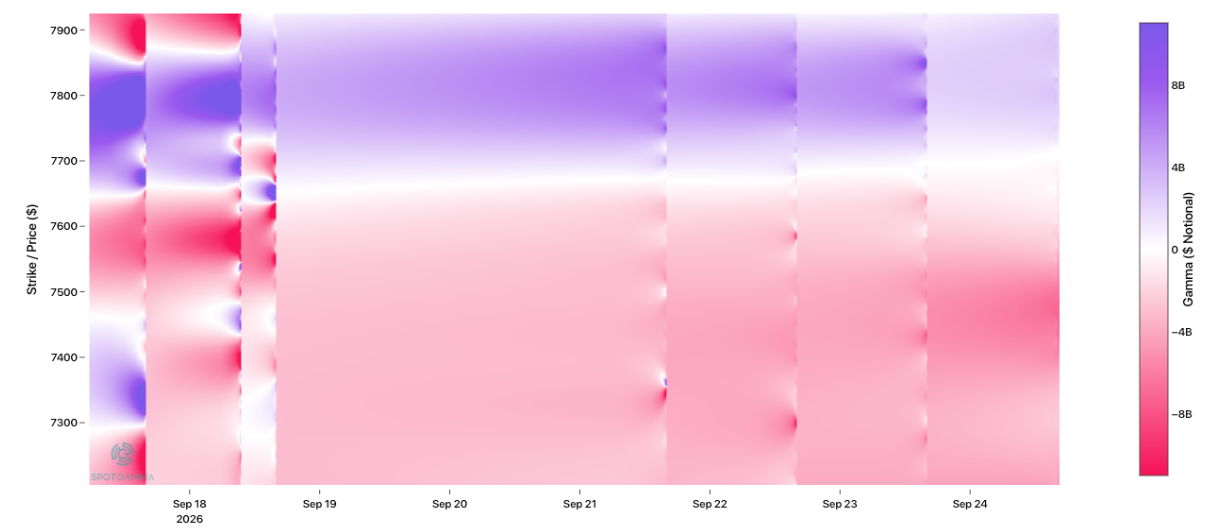
Macro Theme:
Key dates ahead:
- 9/18: OPEX
SG Summary:
Update 9/17: Post-FOMC the oil slide has pushed the SPX back above the ~7,600 Risk Pivot, and vols are sliding lower which opens the market up for further upside. If oil indeed stays <100 then traders are likely to start eyeing the midterm chase. Given this, we will likely look to add to Nov (post-election) upside call structures and maintain those while the SPX holds > Risk Pivot.
9/10: Iran is moving oil higher, which is impact rates, and has the chance to break stocks. We are adding some IWM 1-2 week put structures to hedge downside risks here. Our models show that forward from today <7,600 is pure negative gamma, and if therefore volatility may move markedly higher if that level is broken. If 7,600 is broken, we think a target of 7,350 is reasonable.
Key SG levels for the SPX are:
- Resistance: 7,700
- Pivot: 7,590 (bearish <, bullish >) updated 9/10/26
- Support: 7,600, 7,350
Founder’s Note:
Futures are up +80bps, bringing a full reversion from yesterday’s post-FOMC decline. Equities are being fueled by a sharp decline in oil, with CL -2% to <100.
SPX dealer gamma is currently negative <=7,625 from today out until next week, suggesting price action below remains susceptible to sharp declines.

SPX vols are deflating across the surface as you can see in the day-over-day comparison below. This is a good signal for the bullish cause.

We’ve written a lot about intraday mean reversion leading to very low realized volatility in the S&P500. Yesterday was no different as the SPX touched ~7,500, only to close ~40 handles higher into the close. Structurally, this appears to be very unique behavior as chasing an intraday move has been structurally punished; the longer the horizon, the stronger the tendency for that move to wash back out.
Top chart: if markets are indeed a random walk, wed see variance at 1.0 (dashed black line). Instead we see the SPY and QQQ tent to move farther away from randomness as the day progresses – an indication that moves are reversed rather than extended.
Bottom chart: This chart compares the direction of the morning with the direction of the afternoon. Above zero means the afternoon tends to continue the morning move; below zero means the afternoon tends to reverse it. Recently the lines have fallen from strongly positive to around zero and slightly negative. That tells us morning strength is no longer reliably leading to afternoon strength as the afternoon is increasingly fading or undoing the morning move.

Normally we’d try and point to a strongly positive gamma market to bring about such mean-reverting behavior, but the market has been waffling in-and-around negative gamma. We don’t have a strong insight into why the behavior is so different, but acknowledge the impact that oil and rates (and their headline) are having on equity price action.
In this case here, the oil slide has pushed the SPX back above the ~7,600 Risk Pivot, and vols are sliding lower which opens the market up for further upside. If oil indeed stays <100 then traders are likely to start eyeing the midterm chase. Given this, we will likely look to add to Nov (post-election) upside call structures and maintain those while the SPX holds > Risk Pivot.
©2025 TenTen Capital LLC DBA SpotGamma
All TenTen Capital LLC DBA SpotGamma materials, information, and presentations are for educational purposes only and should not be considered specific investment advice nor recommendations. Futures, foreign currency and options trading contains substantial risk and is not for every investor. An investor could potentially lose all or more than the initial investment. Risk capital is money that can be lost without jeopardizing one’s financial security or lifestyle. Only risk capital should be used for trading and only those with sufficient risk capital should consider trading. Past performance is not necessarily indicative of future results. VIEW FULL RISK DISCLOSURE https://spotgamma.com/model-faq/disclaimer/
|
|
/ESZ26 |
SPX |
SPY |
NDX |
QQQ |
RUT |
IWM |
|---|---|---|---|---|---|---|---|
|
Reference Price: |
$7622.32 |
$7551 |
$754 |
$28945 |
$704 |
$2858 |
$283 |
|
SG Gamma Index™: |
|
-3.02 |
-0.886 |
|
|
|
|
|
SG Implied 1-Day Move: |
|
0.46% |
0.46% |
|
|
|
|
|
SG Implied 5-Day Move: |
|
1.26% |
|
|
|
|
|
|
SG Implied 1-Day Move High: |
|
After open |
After open |
|
|
|
|
|
SG Implied 1-Day Move Low: |
|
After open |
After open |
|
|
|
|
|
SG Volatility Trigger™: |
$7731.32 |
$7660 |
$761 |
$29070 |
$711 |
$2950 |
$291 |
|
Absolute Gamma Strike: |
$7571.32 |
$7500 |
$750 |
$29000 |
$700 |
$2900 |
$285 |
|
Call Wall: |
$8171.32 |
$8100 |
$800 |
$29275 |
$720 |
$3100 |
$300 |
|
Put Wall: |
$7571.32 |
$7500 |
$745 |
$29000 |
$700 |
$2850 |
$280 |
|
Zero Gamma Level: |
$7635.32 |
$7564 |
$764 |
$28655 |
$714 |
$3006 |
$296 |
|
Key Support & Resistance Strikes |
|---|
|
SPX Levels: [7500, 8000, 7600, 7000] |
|
SPY Levels: [750, 760, 745, 755] |
|
NDX Levels: [29000, 29275, 29200, 29500] |
|
QQQ Levels: [700, 710, 690, 705] |
|
SPX Combos: [(7922,65.43), (7899,93.81), (7846,89.21), (7824,83.64), (7809,66.30), (7801,95.72), (7793,77.59), (7778,74.37), (7748,80.21), (7680,69.51), (7673,75.04), (7650,76.63), (7627,85.36), (7597,94.87), (7590,69.58), (7582,76.68), (7574,87.82), (7567,81.45), (7559,80.28), (7552,98.87), (7544,75.40), (7537,86.50), (7529,78.92), (7522,97.32), (7514,92.65), (7506,89.50), (7499,99.90), (7491,91.60), (7484,75.46), (7476,95.28), (7469,90.90), (7461,96.00), (7454,98.59), (7446,65.43), (7439,91.39), (7431,75.04), (7423,95.01), (7408,93.79), (7401,98.78), (7393,82.45), (7386,66.26), (7378,90.58), (7371,70.04), (7363,89.10), (7348,97.32), (7340,67.92), (7333,80.58), (7325,81.03), (7318,69.55), (7310,89.44), (7303,97.16), (7287,69.12), (7272,81.34), (7257,74.75), (7250,90.23), (7227,80.90), (7212,70.75), (7197,94.48)] |
|
SPY Combos: [749.09, 753.63, 739.24, 778.63] |
|
NDX Combos: [28742, 29263, 28337, 27932] |
|
QQQ Combos: [699.66, 713.05, 689.79, 679.93] |
|
|
SPX |
SPY |
NDX |
QQQ |
RUT |
IWM |
|---|---|---|---|---|---|---|
|
Gamma Tilt: |
0.833 |
0.504 |
1.06 |
0.582 |
0.269 |
0.248 |
|
Gamma Notional (MM): |
‑$610.377M |
‑$1.894B |
$6.28M |
‑$990.017M |
‑$191.581M |
‑$2.297B |
|
25 Delta Risk Reversal: |
-0.056 |
-0.052 |
-0.062 |
-0.052 |
-0.056 |
-0.042 |
|
Call Volume: |
850.896K |
1.977M |
11.197K |
1.272M |
32.841K |
455.291K |
|
Put Volume: |
1.245M |
2.929M |
11.851K |
1.824M |
56.234K |
939.221K |
|
Call Open Interest: |
10.775M |
6.462M |
93.277K |
5.662M |
301.20K |
3.153M |
|
Put Open Interest: |
15.153M |
15.406M |
114.922K |
7.776M |
593.221K |
7.938M |
0 comentarios