
Macro Theme:
Key dates ahead:
- 10/13: Bank earnings
- 10/14: CPI
- 11/3: Elections
SG Summary:
Update: 10/12: Vol into CPI on Wednesday 10/14 is very low, and so we want to avoid being short of options into the print as well as OPEX. After Monday, an SPX move >7,825 has the potential to move up quickly due to negative gamma. Support is solid down in to 7,700. <7,700 we shift to a risk-off stance.
10/6: Despite higher yields, stocks are sliding higher. If those yields come down, then we may see strong moves higher in stocks. Given this, we think its critical to maintain upside exposure, and for that we prefer NVDA Nov of Dec calls as the IV rank for NVDA is <5.
Key SG levels for the SPX are:
- Resistance: 7,830, 7,850, 7,900
- Pivot: 7,690 (bearish <, bullish >) updated 9/22/26
- Support: 7,800, 7,750, 7,700
Founder’s Note:
Futures are flat ahead of bank earnings and home sales data at 10 AM EST. US10Y 5.19% from +5.3% last week.
The key positive gamma range noted the last several days remains in tact: 7,700 – 7,800. We do not think the market is poised to move much today, with CPI on deck tomorrow.
That being said, the market does have a problem: a complete lack of volatility being priced in. We want to be long of Nov options here as we think realized vol is poised to once again wake up – just as it did out of Sep OPEX.
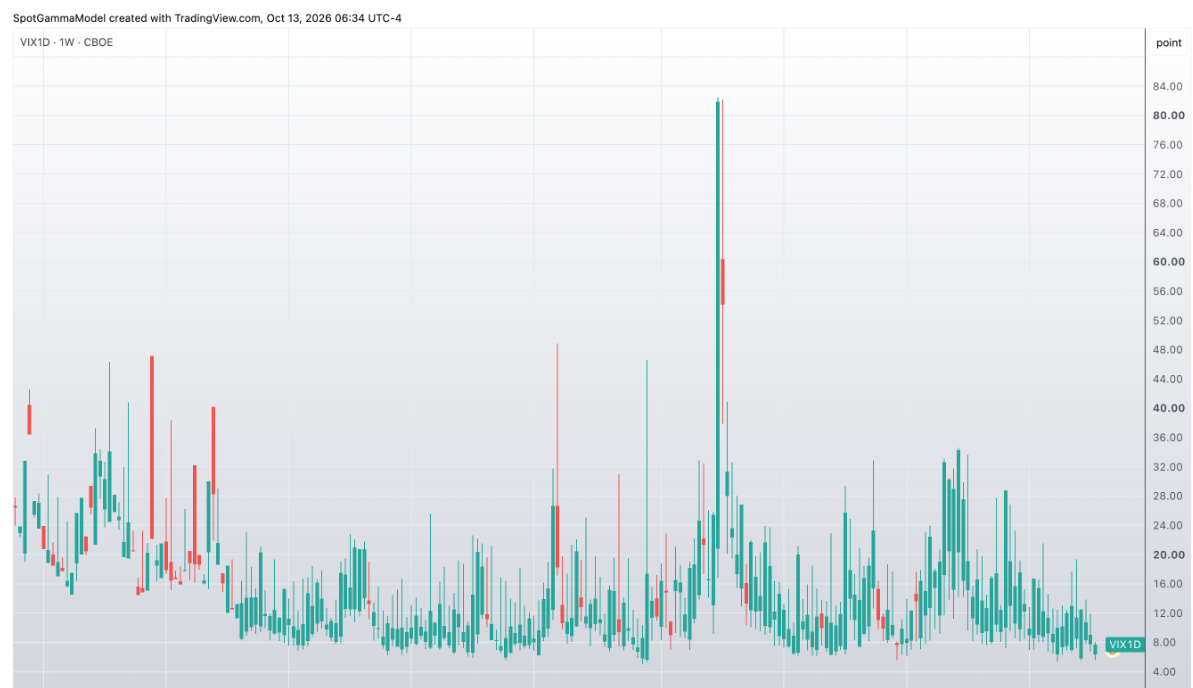
Starting with an indexified measure of vol, VIX1D, you can see it is at a lower bound of ~7. A backtest on this shows that forward SPY returns are essentially flat. It is not a signal of an explosive pending move. With CPI and earnings afoot, we think “this time may be different”.

Stepping out farther in tenor, we see that SPX 3 month IV is also at nearly 2-year lows – this despite all of the things going on (wars, rates, elections). And while you may not agree with wanting to be long of options here, we are hard pressed to find a reason why shorting them is worth the risk-reward.

About a month ago ago, out of Sep OPEX, we had remarked that volatility was poised to break out. That seemed to come to fruition as the Nasdaq broke 6% higher into October. Then, as rates ripped higher the equity market did something odd: it stalled (recall all those MOVE vs VIX conversations). Over that same time frame, traders seem to have also shifted from a META-driven AI hope, to tech-malaise. You can see that “wedge breakout” in realized vol from the SMH chart below – and you can also see the big fade. In fact this morning SMH is down another ~1.5% as Chinese memory/chip makers are allegedly increasing production.

If the equity space loses a tech bid, some other sector clearly has to carry the bullish baton. It’s possible lower rates via a cool CPI could drive the lagging non-tech sector. TSM earnings on 10/15 is the first major tech co to report, and on that point you can see that single stocks generally carry a rich IV (left), but the call skew has faded (right) as traders sour on tech.

On the idea of shifting to other bullish vectors, you can see the put/call ratios for tech are indeed off highs (shades of red) while other, more beaten up sectors, are finding some higher relative call volumes. We’re not sure if this is simply some bottom fishing or something more substantial, but its looks like a potential transition is underway. Consider XLF – its down 10% from its Aug 1 highs while seeing call-heavy volumes – particularly as rates come off (and major earnings this AM).

©2025 TenTen Capital LLC DBA SpotGamma
All TenTen Capital LLC DBA SpotGamma materials, information, and presentations are for educational purposes only and should not be considered specific investment advice nor recommendations. Futures, foreign currency and options trading contains substantial risk and is not for every investor. An investor could potentially lose all or more than the initial investment. Risk capital is money that can be lost without jeopardizing one’s financial security or lifestyle. Only risk capital should be used for trading and only those with sufficient risk capital should consider trading. Past performance is not necessarily indicative of future results. VIEW FULL RISK DISCLOSURE https://spotgamma.com/model-faq/disclaimer/
|
|
/ESZ26 |
SPX |
SPY |
NDX |
QQQ |
RUT |
IWM |
|---|---|---|---|---|---|---|---|
|
Reference Price: |
$7855.25 |
$7807 |
$778 |
$30664 |
$746 |
$2794 |
$277 |
|
SG Gamma Index™: |
|
4.184 |
-0.025 |
|
|
|
|
|
SG Implied 1-Day Move: |
|
0.51% |
0.51% |
|
|
|
|
|
SG Implied 5-Day Move: |
|
1.22% |
|
|
|
|
|
|
SG Implied 1-Day Move High: |
|
After open |
After open |
|
|
|
|
|
SG Implied 1-Day Move Low: |
|
After open |
After open |
|
|
|
|
|
SG Volatility Trigger™: |
$7823.25 |
$7775 |
$777 |
$30750 |
$746 |
$2850 |
$281 |
|
Absolute Gamma Strike: |
$8048.25 |
$8000 |
$775 |
$31000 |
$740 |
$2800 |
$280 |
|
Call Wall: |
$7948.25 |
$7900 |
$785 |
$30800 |
$760 |
$2855 |
$284 |
|
Put Wall: |
$7548.25 |
$7500 |
$772 |
$30200 |
$740 |
$2750 |
$275 |
|
Zero Gamma Level: |
$7751.25 |
$7703 |
$776 |
$30357 |
$744 |
$2851 |
$288 |
|
Key Support & Resistance Strikes |
|---|
|
SPX Levels: [8000, 7800, 7000, 7700] |
|
SPY Levels: [775, 780, 770, 778] |
|
NDX Levels: [31000, 30000, 30500, 30800] |
|
QQQ Levels: [740, 750, 745, 730] |
|
SPX Combos: [(8190,87.74), (8182,90.24), (8174,71.63), (8166,82.96), (8159,91.65), (8151,97.50), (8143,80.64), (8127,95.21), (8120,82.47), (8112,74.21), (8096,99.49), (8088,80.78), (8080,79.19), (8073,91.38), (8057,81.41), (8049,99.39), (8041,92.39), (8034,73.56), (8026,91.68), (8018,73.82), (8010,76.62), (8002,99.54), (7987,75.27), (7979,82.70), (7971,89.28), (7963,76.81), (7956,72.97), (7948,97.82), (7940,79.61), (7932,89.25), (7924,97.06), (7917,93.33), (7909,94.70), (7901,99.84), (7893,91.53), (7885,90.59), (7878,99.56), (7870,98.77), (7862,93.47), (7854,86.15), (7846,99.70), (7838,98.07), (7831,96.66), (7823,99.70), (7815,92.59), (7807,97.65), (7799,98.84), (7792,84.29), (7776,65.62), (7768,90.63), (7760,89.36), (7753,95.68), (7745,92.61), (7737,88.19), (7729,86.38), (7721,92.58), (7714,88.39), (7706,70.13), (7698,97.01), (7682,75.26), (7675,87.07), (7667,88.63), (7659,85.13), (7651,95.55), (7643,82.51), (7628,88.47), (7596,96.69), (7589,70.66), (7573,89.03), (7550,87.84), (7526,86.38), (7503,97.07), (7472,72.03), (7448,88.90), (7425,82.40)] |
|
SPY Combos: [787.09, 780.09, 797.21, 807.34] |
|
NDX Combos: [31247, 30419, 29806, 30205] |
|
QQQ Combos: [760.25, 770.02, 754.24, 724.95] |
|
|
SPX |
SPY |
NDX |
QQQ |
RUT |
IWM |
|---|---|---|---|---|---|---|
|
Gamma Tilt: |
1.318 |
0.982 |
1.171 |
0.868 |
0.466 |
0.399 |
|
Gamma Notional (MM): |
$1.13B |
$269.297M |
$4.993M |
‑$196.411M |
‑$102.285M |
‑$1.741B |
|
25 Delta Risk Reversal: |
-0.036 |
0.00 |
-0.048 |
-0.033 |
-0.031 |
-0.015 |
|
Call Volume: |
513.509K |
1.098M |
8.375K |
923.611K |
22.992K |
312.585K |
|
Put Volume: |
689.211K |
1.494M |
9.808K |
1.23M |
31.18K |
256.991K |
|
Call Open Interest: |
9.672M |
5.815M |
81.886K |
5.314M |
319.683K |
3.442M |
|
Put Open Interest: |
14.057M |
13.141M |
126.171K |
7.825M |
505.446K |
7.616M |
0 comentarios