
Macro Theme:
Key dates ahead:
- 10/28: FOMC, GOOGL/MSFT ER
- 11/3: Elections
SG Summary:
Update 10/20: Correlations are starting to rise in the back end, with the SPX threatening to lose the Risk Pivot into higher oil prices (CL $101 1-month highs). Single stock options have also flipped from call skews to put skews. Given this, we are going to add to some Dec put spreads in SPY. Note the “wash out” level in SPX remains 7,450. We elect for Dec as the relative time decay of these puts should be lower due to FOMC(s) and elections. We will want to be rolling into shorter dated call flies if the SPX regains 7,700, with eyes on a test of 7,800.
10/6: Despite higher yields, stocks are sliding higher. If those yields come down, then we may see strong moves higher in stocks. Given this, we think its critical to maintain upside exposure, and for that we prefer NVDA Nov of Dec calls as the IV rank for NVDA is <5.
Key SG levels for the SPX are:
- Resistance: 7,700, 7,720, 7,750, 7,800
- Pivot: 7,690 (bearish <, bullish >) updated 9/22/26
- Support: 7,650, 7,600, 7,450
Founder’s Note:
Futures are materially lower: ES – 95bps, NQ -163bps. Oil is higher by 1.6%. US 10Y down now to 5.05%.
META -2% after earnings, TSLA -3.6%.
The chop continues, but things are certainly more bearish today. The SPX is opening under our Risk Pivot (7,690), with resistance, for today at 7,700. First support is 7,650, followed by 7,600. Ultimately the concern here is that vol continues to be bid, and if we see selling in RSP, DIA, etc (i.e. non-tech), or a lift in correlation, then we will be looking for a move down into 7,450.
VIX expiration appears to have coincided with a local low in volatility, as the VIX is up now to 18s vs 16s yesterday. This is being aided on by escalated conflicts in he Middle East.
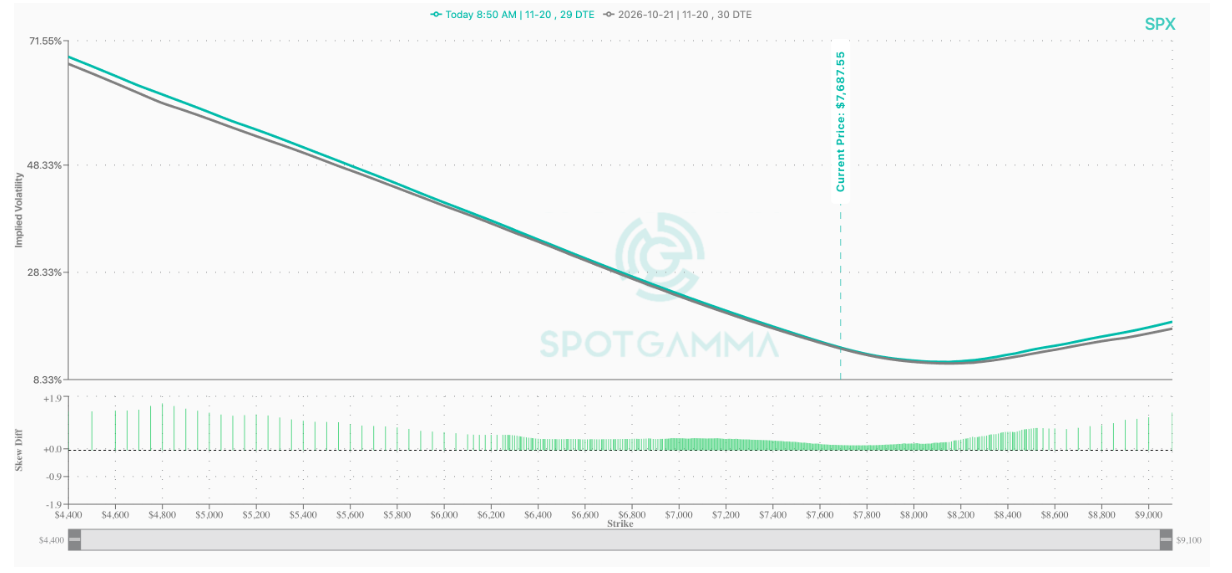
The whole SPX vol surface is indeed lifting with futures down nearly 1%. Since there is not yet a lift in the put skew, we can frame this as a reaction to the overnight volatility. Vol being bid into selling leads us to believe the selling has a bit more teeth.

While there has been a lot of intraday chop – its mainly been in the SPX. NDX has been seeing more “trend days”, with a larger ~6% downside move into last week, and mild bounce the last few days. The chart below compares the move of the first 1/2 session to the last 1/2 of the day. High correlation signals the morning move extends to the afternoon, which brings higher correlation values. You can see how the QQQ (purple) exhibits more trend than SPY (teal). This is a picture of the instability of tech vs relative stability in SPX – and the concern here is that SPX starts to “sync up” with tech. Below 7,700 we will continue to assign odds that stocks sync up to the downside.

©2025 TenTen Capital LLC DBA SpotGamma
All TenTen Capital LLC DBA SpotGamma materials, information, and presentations are for educational purposes only and should not be considered specific investment advice nor recommendations. Futures, foreign currency and options trading contains substantial risk and is not for every investor. An investor could potentially lose all or more than the initial investment. Risk capital is money that can be lost without jeopardizing one’s financial security or lifestyle. Only risk capital should be used for trading and only those with sufficient risk capital should consider trading. Past performance is not necessarily indicative of future results. VIEW FULL RISK DISCLOSURE https://spotgamma.com/model-faq/disclaimer/
|
|
/ESZ26 |
SPX |
SPY |
NDX |
QQQ |
RUT |
IWM |
|---|---|---|---|---|---|---|---|
|
Reference Price: |
$7798.52 |
$7757 |
$773 |
$29822 |
$725 |
$2781 |
$276 |
|
SG Gamma Index™: |
|
1.927 |
-0.253 |
|
|
|
|
|
SG Implied 1-Day Move: |
|
0.60% |
0.60% |
|
|
|
|
|
SG Implied 5-Day Move: |
|
1.15% |
|
|
|
|
|
|
SG Implied 1-Day Move High: |
|
After open |
After open |
|
|
|
|
|
SG Implied 1-Day Move Low: |
|
After open |
After open |
|
|
|
|
|
SG Volatility Trigger™: |
$7801.52 |
$7760 |
$772 |
$29590 |
$725 |
$2760 |
$277 |
|
Absolute Gamma Strike: |
$8041.52 |
$8000 |
$780 |
$30000 |
$720 |
$2800 |
$280 |
|
Call Wall: |
$7941.52 |
$7900 |
$780 |
$29675 |
$731 |
$2850 |
$281 |
|
Put Wall: |
$7691.52 |
$7650 |
$760 |
$28000 |
$700 |
$2700 |
$270 |
|
Zero Gamma Level: |
$7753.52 |
$7712 |
$771 |
$29523 |
$729 |
$2816 |
$286 |
|
Key Support & Resistance Strikes |
|---|
|
SPX Levels: [8000, 7000, 7700, 7800] |
|
SPY Levels: [780, 770, 760, 775] |
|
NDX Levels: [30000, 29675, 29000, 31000] |
|
QQQ Levels: [720, 700, 730, 740] |
|
SPX Combos: [(8137,79.61), (8130,89.84), (8122,90.13), (8106,75.68), (8098,99.24), (8091,79.02), (8083,70.58), (8075,75.08), (8067,85.14), (8060,75.98), (8052,98.89), (8036,92.05), (8029,93.89), (8021,68.20), (8013,75.42), (7998,99.27), (7990,70.67), (7982,74.41), (7974,84.41), (7967,66.17), (7959,75.56), (7951,94.45), (7943,75.98), (7928,95.97), (7920,80.29), (7912,88.96), (7897,99.82), (7889,74.20), (7881,90.62), (7874,97.54), (7866,72.87), (7858,95.60), (7850,97.80), (7842,93.05), (7835,75.14), (7827,98.98), (7819,93.59), (7811,98.07), (7804,99.84), (7796,79.18), (7788,98.27), (7780,86.39), (7773,94.23), (7749,98.62), (7726,95.27), (7718,93.48), (7711,77.69), (7703,99.38), (7695,88.06), (7687,93.98), (7680,80.22), (7672,96.39), (7664,74.24), (7656,84.56), (7649,99.48), (7641,68.90), (7633,83.68), (7625,93.77), (7618,77.44), (7602,98.43), (7587,81.21), (7579,89.30), (7563,65.37), (7548,93.38), (7532,66.40), (7524,89.50), (7517,76.56), (7509,65.36), (7501,98.60), (7493,64.25), (7478,90.55), (7447,92.55), (7424,84.58), (7400,94.61), (7377,84.43)] |
|
SPY Combos: [767.47, 762.86, 757.47, 747.48] |
|
NDX Combos: [28779, 29196, 28361, 29614] |
|
QQQ Combos: [700.3, 710.34, 690.25, 721.83] |
|
|
SPX |
SPY |
NDX |
QQQ |
RUT |
IWM |
|---|---|---|---|---|---|---|
|
Gamma Tilt: |
1.141 |
0.823 |
1.078 |
0.760 |
0.693 |
0.506 |
|
Gamma Notional (MM): |
$551.543M |
‑$326.309M |
$1.999M |
‑$518.953M |
‑$46.816M |
‑$1.039B |
|
25 Delta Risk Reversal: |
-0.041 |
-0.023 |
-0.059 |
-0.042 |
-0.033 |
-0.018 |
|
Call Volume: |
749.933K |
1.426M |
8.665K |
1.113M |
16.354K |
329.272K |
|
Put Volume: |
1.072M |
1.82M |
12.031K |
1.436M |
28.606K |
701.629K |
|
Call Open Interest: |
9.478M |
5.946M |
80.272K |
5.391M |
310.045K |
3.289M |
|
Put Open Interest: |
13.918M |
12.273M |
107.879K |
7.748M |
507.256K |
7.479M |
0 comentarios