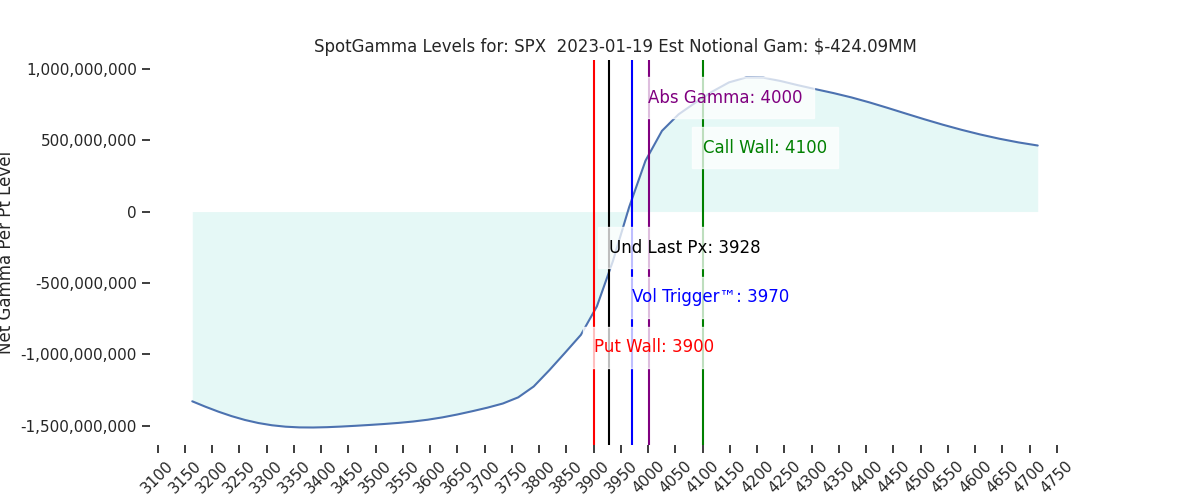
Futures are down 15pts to 3930, which is near the SPY 390 Put Wall. SG levels are little changed, with 390 SPY (3915 SPX) – 3900 SPX as critical support. A break of 3900 implies a test of 3860. Above we see resistance at 3960-3970 (SPY 395 equivalent + Vol Trigger).
For today we look for 3900 to hold today as we think very short term options traders will look to buy the dip via selling IV. Overall we now assign a bearish edge to markets as the SPX is below the Vol Trigger (3970, chart here).
Heading into yesterday, we were of the opinion that markets would remain stable into tomorrow, and that volatility could pop next week. This was based on 4000 being an area of large gamma with just a few days before OPEX. Further, we wrote that a break of 395 SPY (3965 SPX/Vol Trigger) would render the OPEX pin “broken”.
The “sub 4k” bounce did not manifest, and there was a clear bid to IV that did not relent. Traders had a slew of opinions as to why the market declined (Bullard’s comments, oil, and even Powell having covid). The failure of IV to revert yesterday is the critical insight.
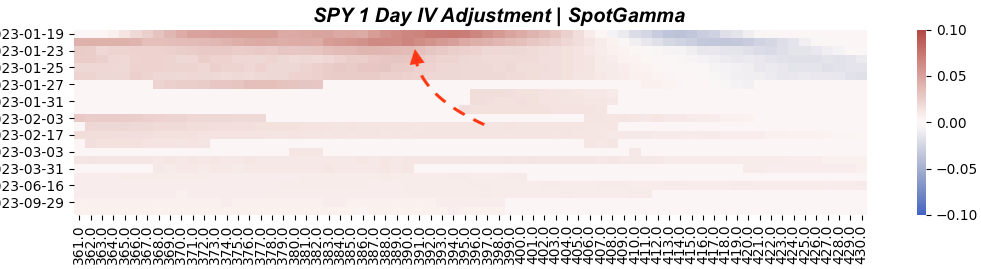
The fact is, in our view, IV was likely just too cheap both on a 0DTE basis – but also longer term (discussed below). In all time frames its clear traders shifted to favoring long puts into yesterdays decline. We can see this via the IV heatmap below.
This is in beta form, but uses some proprietary logic to reflect volatility expectations over the past trading session. You can see the deeper pocket of red (arrow) in very short term options, which shows that traders had to suddenly adjust from very light downside volatility expectations (~50bps moves) to more moderate (+1% moves). Again, we see this as a “moderation” in IV, not a “panic”. Also note the area of blue which shows that call tails were crushed (raging bulls are suddenly quiet).
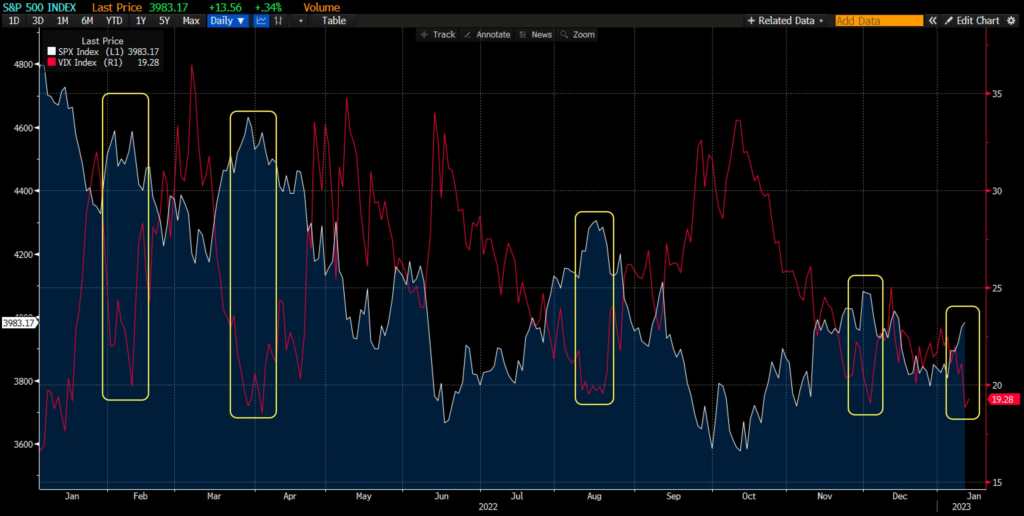
This theme of IV being too cheap was most easily seen in the VIX vs SPX (shown below), wherein on Monday we highlighted that relative market highs have come with VIX < 20. While we discussed this in Mondays note, we admittedly did not anticipate a rebound in IV until next week (post-OPEX). Yesterdays pop in IV/VIX seems now more in sync with reality.
This presents a somewhat murky situation here. As you can see in the SPX term structure below, the entire volatility surface lifted yesterday (red = 1/18, white = 1/19). The key date ahead is obviously 2/1 FOMC. While FOMC is nearly 2 weeks out, we think its unlikely that IV revisits lows due as OPEX passes and positions are reset. This may keep volatility elevated into next week, and IV may then stay elevated as we approach FOMC. This likely means larger trading ranges, with “swings” more prevalent than a large directional move. Key levels for next week will need to be assessed out of OPEX (thus the “murkiness”, but it appears 4000 is likely to remain strong interim resistance, with 3800 support.

| SpotGamma Proprietary SPX Levels | Latest Data | SPX Previous | SPY | NDX | QQQ |
|---|---|---|---|---|---|
| Ref Price: | 3928 | 3945 | 391 | 11410 | 277 |
| SG Implied 1-Day Move:: | 0.89%, | (±pts): 35.0 | VIX 1 Day Impl. Move:1.28% | ||
| SG Implied 5-Day Move: | 2.76% | 3998 (Monday Ref Price) | Range: 3888.0 | 4109.0 | ||
| SpotGamma Gamma Index™: | -0.58 | 0.53 | -0.37 | 0.07 | -0.06 |
| Volatility Trigger™: | 3970 | 3970 | 396 | 11240 | 279 |
| SpotGamma Absolute Gamma Strike: | 4000 | 4000 | 390 | 11275 | 280 |
| Gamma Notional(MM): | -424.0 | -309.0 | -1808.0 | 12.0 | -398.0 |
| Put Wall: | 3900 | 3900 | 390 | 11350 | 270 |
| Call Wall : | 4100 | 4050 | 400 | 11275 | 290 |
| Additional Key Levels | Latest Data | Previous | SPY | NDX | QQQ |
|---|---|---|---|---|---|
| Zero Gamma Level: | 3955 | 3972 | 396.0 | 10898.0 | 301 |
| CP Gam Tilt: | 0.87 | 0.87 | 0.62 | 1.74 | 0.8 |
| Delta Neutral Px: | 3955 | ||||
| Net Delta(MM): | $1,560,589 | $1,437,474 | $165,455 | $53,178 | $85,403 |
| 25D Risk Reversal | -0.04 | -0.04 | -0.04 | -0.05 | -0.05 |
| Call Volume | 683,796 | 556,637 | 2,555,669 | 10,671 | 816,155 |
| Put Volume | 1,075,400 | 985,801 | 3,782,298 | 8,871 | 1,382,812 |
| Call Open Interest | 6,085,096 | 5,992,441 | 7,117,514 | 71,284 | 5,022,762 |
| Put Open Interest | 10,991,470 | 10,474,817 | 13,318,016 | 66,554 | 6,993,446 |
| Key Support & Resistance Strikes: |
|---|
| SPX: [4000, 3950, 3900, 3850] |
| SPY: [400, 395, 390, 385] |
| QQQ: [285, 280, 275, 270] |
| NDX:[12000, 11600, 11500, 11275] |
| SPX Combo (strike, %ile): [(4102.0, 90.66), (4074.0, 83.26), (4066.0, 84.65), (4051.0, 90.2), (4031.0, 79.12), (4023.0, 81.48), (4011.0, 75.22), (4000.0, 89.65), (3913.0, 90.99), (3901.0, 97.14), (3894.0, 77.75), (3882.0, 88.3), (3874.0, 89.45), (3862.0, 83.79), (3854.0, 77.3), (3850.0, 91.87), (3827.0, 75.36), (3811.0, 87.21), (3799.0, 94.14), (3748.0, 88.6)] |
| SPY Combo: [388.75, 378.57, 383.66, 389.92, 408.72] |
| NDX Combo: [11273.0, 11091.0, 10885.0, 11502.0, 11296.0] |