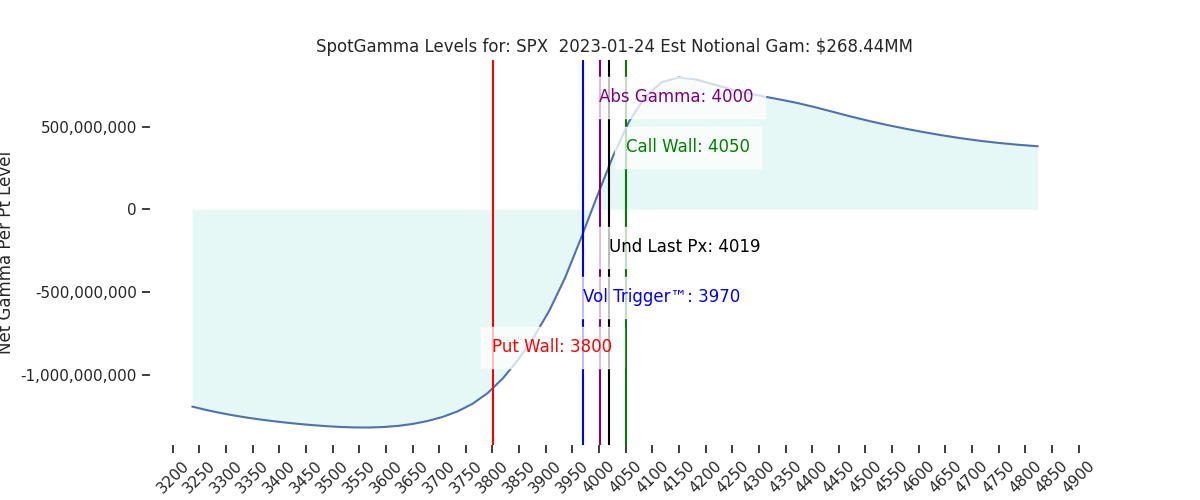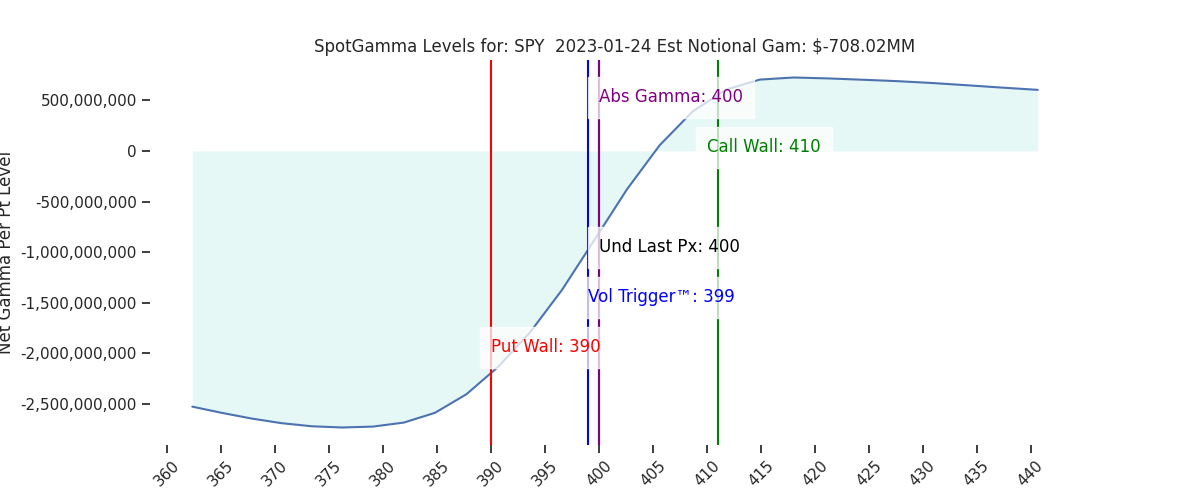
Futures are down slightly to 4025. Key SG levels in the S&P are largely unchanged, with resistance remaining at the 4050 SPX Call Wall, followed by 4064 (SPY 405). Support shows at 4020 (SPY 400), then 4000. We anticipate 4000 will hold as support today.
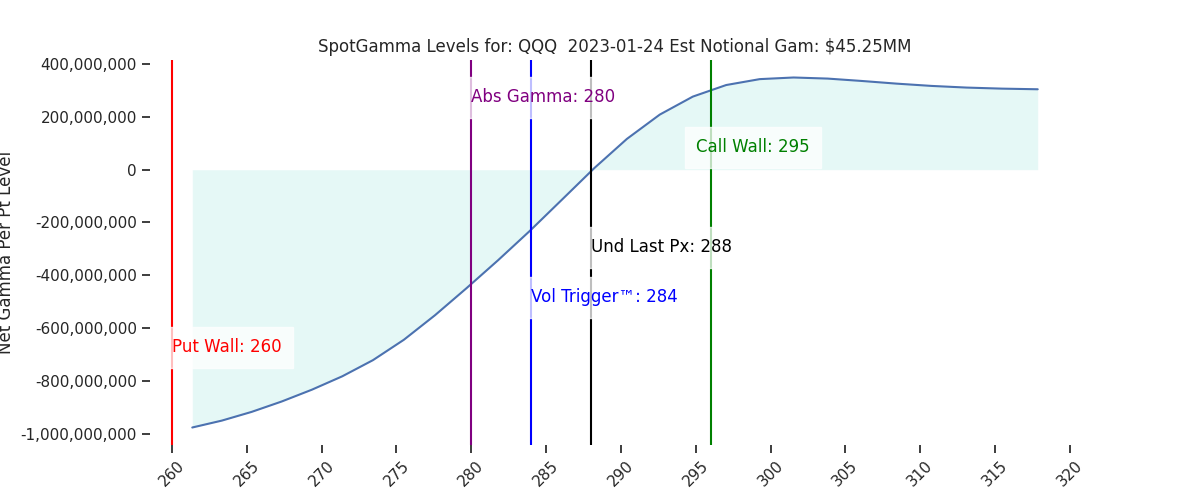
While S&P levels are unchanged, there was a large jump 10pt jump in QQQ Call Wall. Generally we view the Call Wall(s) shifting higher as a bullish indicator, because it signals options traders are building positions at higher strikes. The jump in QQQ is large, but given Fridays OPEX (clearing of positions) and large rally (+2%) its not shocking. What is interesting is that there was such a jump in QQQ, but a lag in the S&P.
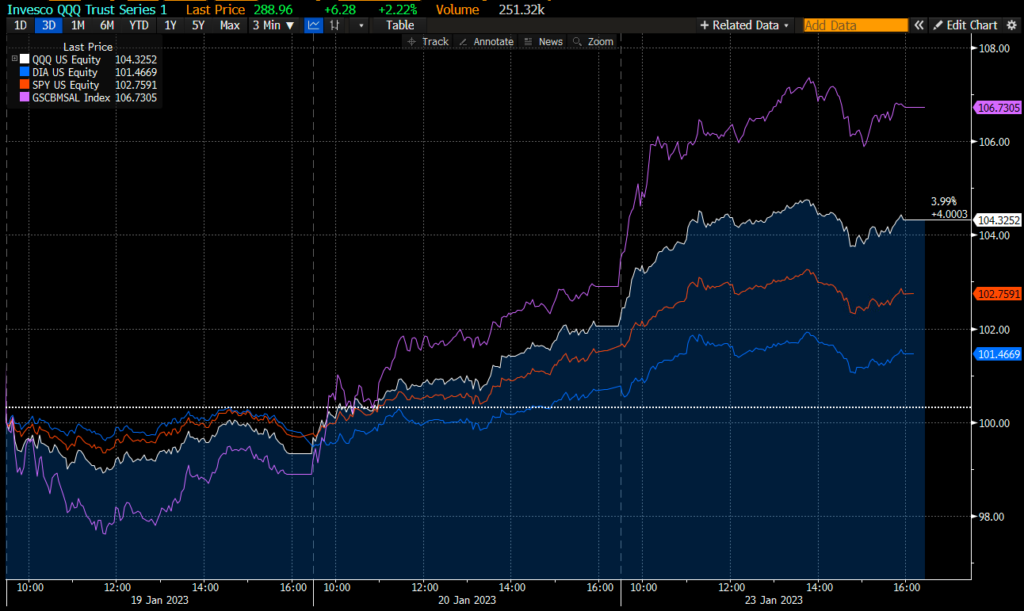
That highlights a key feature about the rally the last few days: it’s very concentrated in things which benefit from the “fed pivot” narrative. In other words, the worst performing (most shorted) stuff is all bouncing the most.
Shown below is the 3 day performance of the GS most shorted stocks basket (purple) vs QQQ (white), SPY (red) and DIA(blue). Recall that the DOW (DIA) has sharply outperformed QQQ over the past year by ~15%
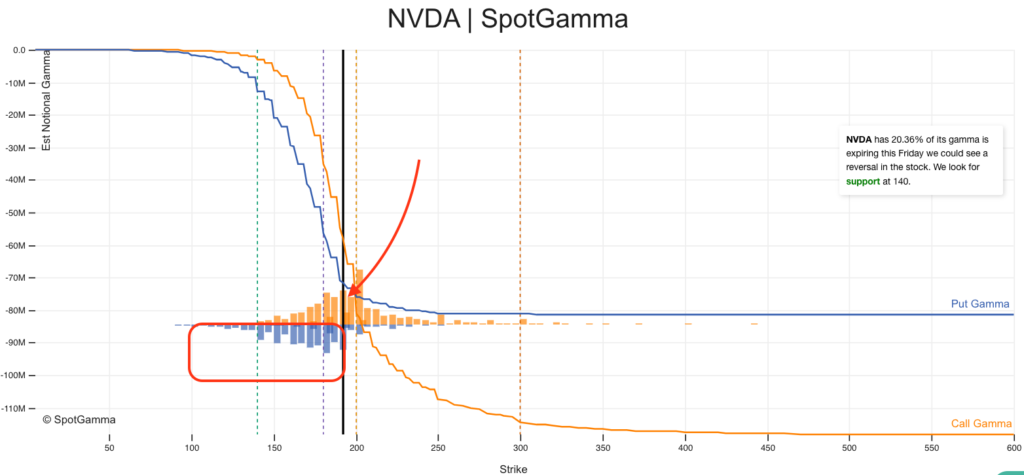
Whats equally as interesting is many stocks with strong rallies all shifted to a very interesting equilibrium yesterday. Consider NVDA, which was up +7% yesterday, it rallied right to the point at which there are put strikes (blue bars) disappear. You can see at the red arrow in the chart below, and its a similar phenomenon in a slew of other tech names (AAPL, SQ, CRWD). What this reads like it a put rally, somewhat like short covering.
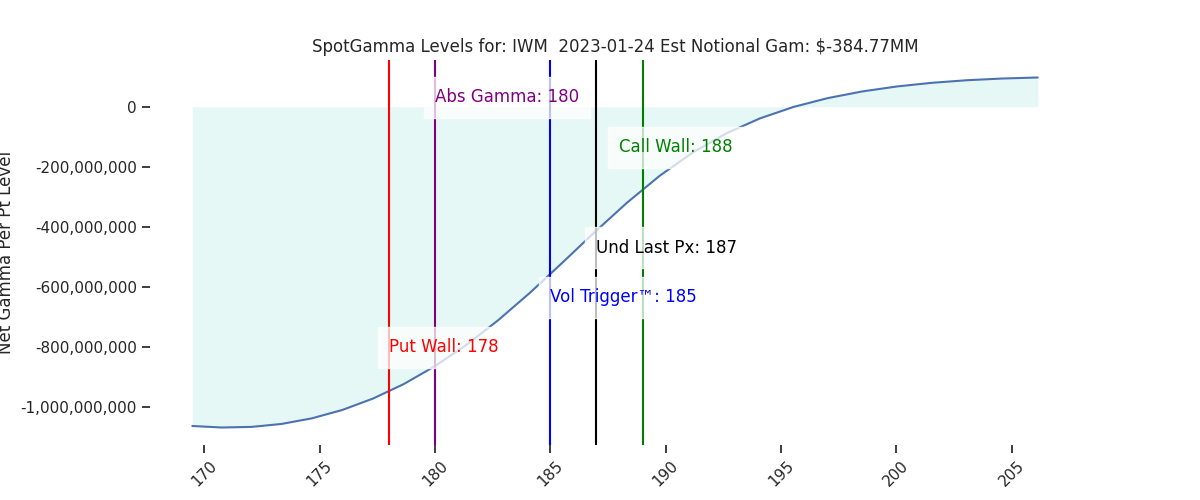
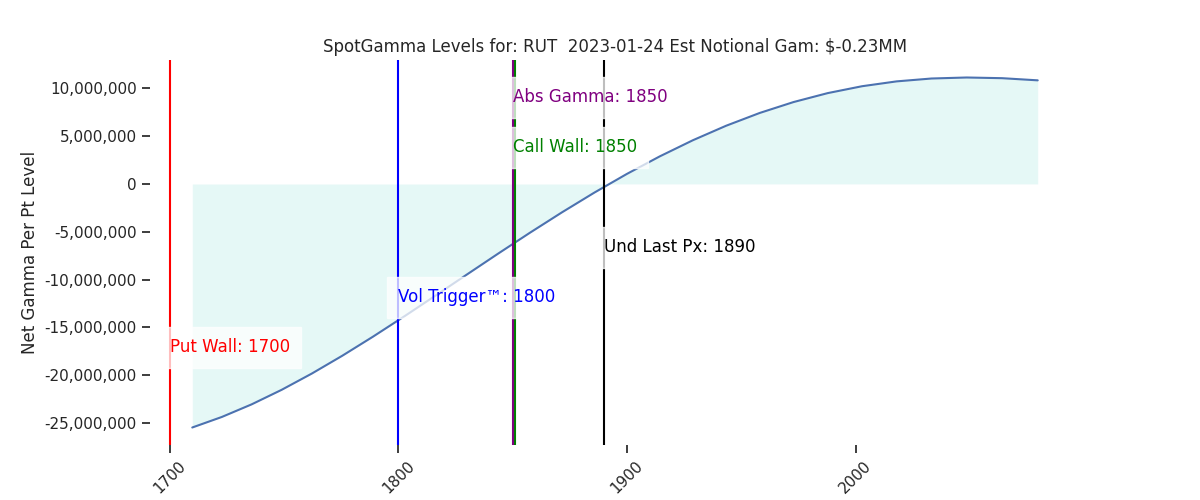
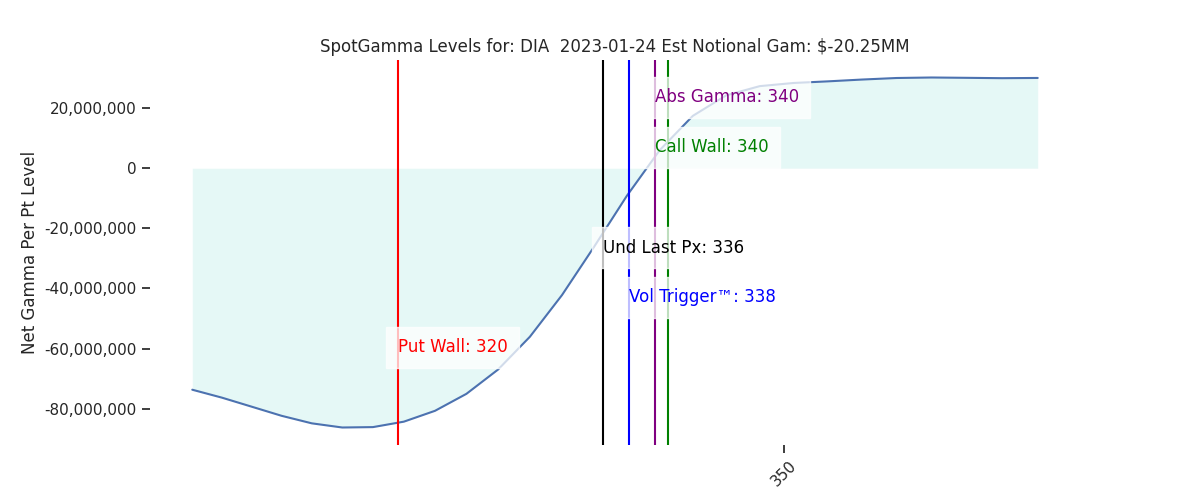
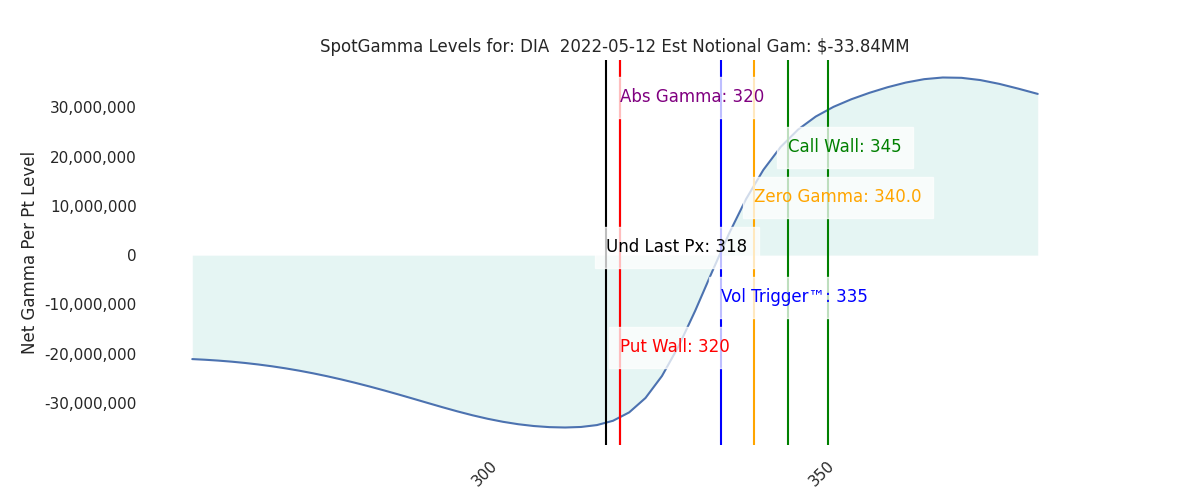
| SpotGamma Proprietary SPX Levels | Latest Data | SPX Previous | SPY | NDX | QQQ |
|---|---|---|---|---|---|
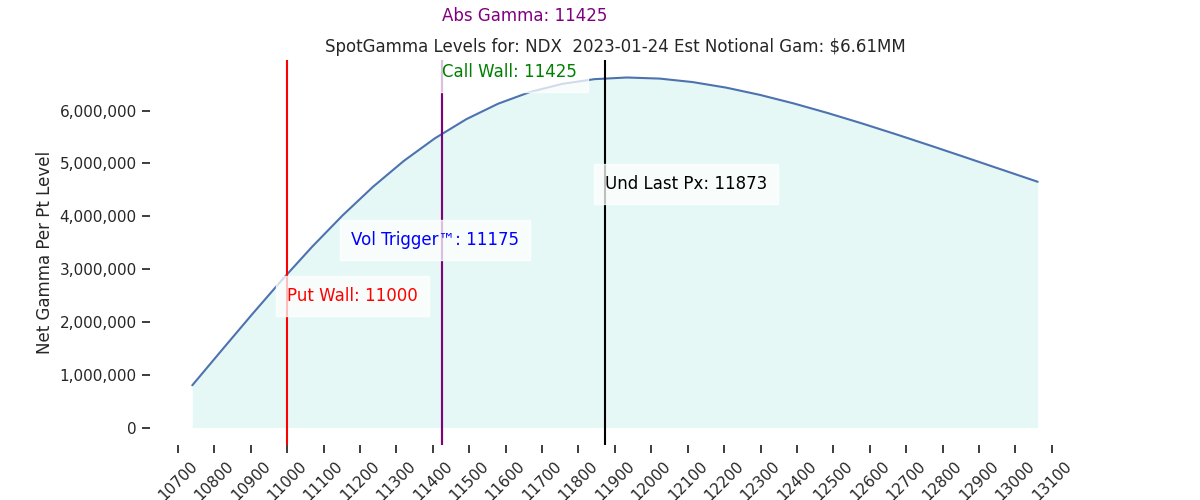
| Ref Price: | 4019 | 4008 | 400 | 11873 | 288 |
| SG Implied 1-Day Move:: | 1.19%, | (±pts): 48.0 | VIX 1 Day Impl. Move:1.24% | ||
| SG Implied 5-Day Move: | 2.86% | 3971 (Monday Ref Price) | Range: 3858.0 | 4085.0 | ||
| SpotGamma Gamma Index™: | 0.83 | 0.13 | -0.13 | 0.04 | 0.01 |
| Volatility Trigger™: | 3970 | 3945 | 399 | 11175 | 284 |
| SpotGamma Absolute Gamma Strike: | 4000 | 4000 | 400 | 11425 | 280 |
| Gamma Notional(MM): | 268.0 | 416.0 | -708.0 | 7.0 | 45.0 |
| Put Wall: | 3800 | 3800 | 390 | 11000 | 260 |
| Call Wall : | 4050 | 4050 | 410 | 11425 | 295 |
| Additional Key Levels | Latest Data | Previous | SPY | NDX | QQQ |
|---|---|---|---|---|---|
| Zero Gamma Level: | 3986 | 3975 | 403.0 | 0 | 306 |
| CP Gam Tilt: | 1.26 | 1.27 | 0.8 | 1.71 | 1.03 |
| Delta Neutral Px: | 3956 | ||||
| Net Delta(MM): | $1,405,734 | $1,369,879 | $155,677 | $48,901 | $81,262 |
| 25D Risk Reversal | -0.05 | -0.06 | -0.04 | -0.05 | -0.05 |
| Call Volume | 638,140 | 584,232 | 2,447,056 | 13,942 | 1,023,539 |
| Put Volume | 1,058,389 | 863,314 | 3,844,512 | 10,346 | 1,229,538 |
| Call Open Interest | 5,301,703 | 5,234,182 | 5,658,822 | 55,542 | 4,025,443 |
| Put Open Interest | 9,692,956 | 9,429,234 | 11,908,964 | 53,975 | 6,516,205 |
| Key Support & Resistance Strikes: |
|---|
| SPX: [4050, 4000, 3950, 3900] |
| SPY: [400, 398, 395, 390] |
| QQQ: [300, 290, 285, 280] |
| NDX:[12000, 11500, 11425, 11000] |
| SPX Combo (strike, %ile): [(4200.0, 93.71), (4176.0, 81.35), (4148.0, 91.64), (4124.0, 76.77), (4116.0, 79.52), (4100.0, 96.65), (4076.0, 93.98), (4064.0, 93.72), (4060.0, 78.0), (4056.0, 78.0), (4052.0, 98.32), (4044.0, 77.09), (4040.0, 82.46), (4036.0, 88.74), (4032.0, 89.13), (4024.0, 95.39), (4020.0, 81.71), (3999.0, 94.2), (3963.0, 78.45), (3915.0, 83.9), (3899.0, 92.25), (3851.0, 83.2)] |
| SPY Combo: [403.84, 408.64, 401.03, 398.63, 406.24] |
| NDX Combo: [11423.0, 12123.0, 11921.0, 12004.0, 12325.0] |