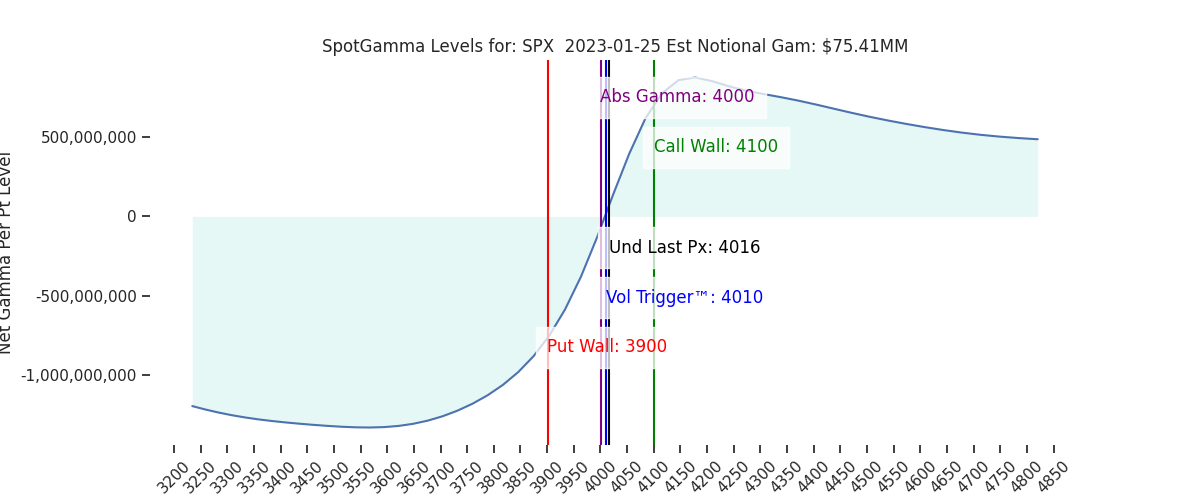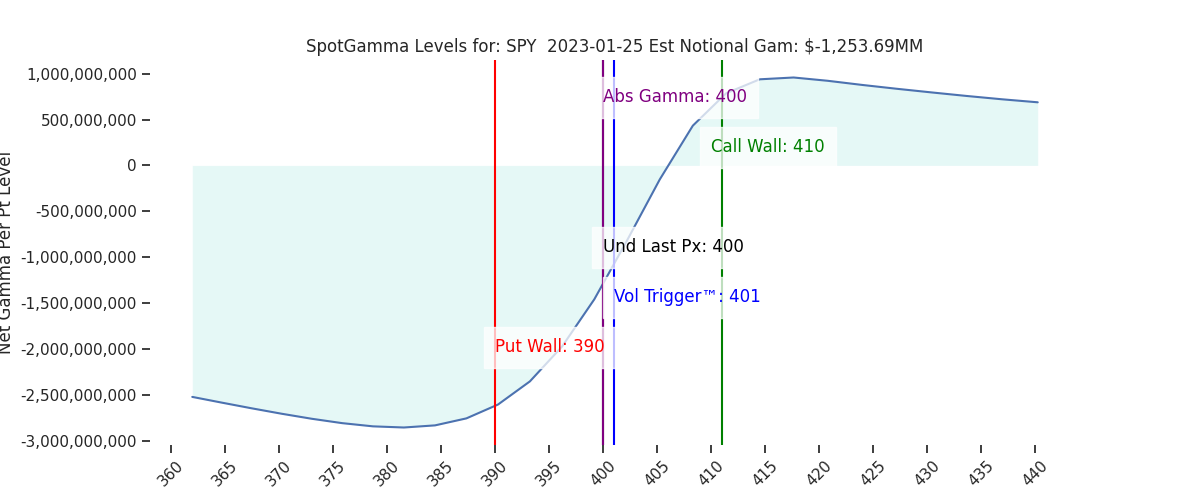
Futures are down to the 4000 area this morning. There were some notable shifts in key SG levels, with the 400 SPY (4020SPX) & 4000 SPX levels remaining the key pivot area. Resistance above this 4000-4020 pivot area is at 4050 & 4065. Support below is at 3985 then 3950. Our models assign a bearish edge to markets on a close below 4000.
TLDR: We are bearish under $4000, with $3900 support. Further an equity rally >$4050 is likely off the table until 2/1 FOMC.
Whats clearly happened is our key levels have all shifted higher (Call Wall, Put Wall, Vol Trigger). Generally we read this as a bullish indication, and that seems to match the overall sentiment into yesterdays close.
Functionally you can see whats happened is that all the call interest from 390SPY/3900SPX has shifted up into the 400/4000’s (shown below). Will that shift, our levels rise. While on the surface this is bullish, it also now shifts up the “maginot risk line”, from 3900 to 4000.
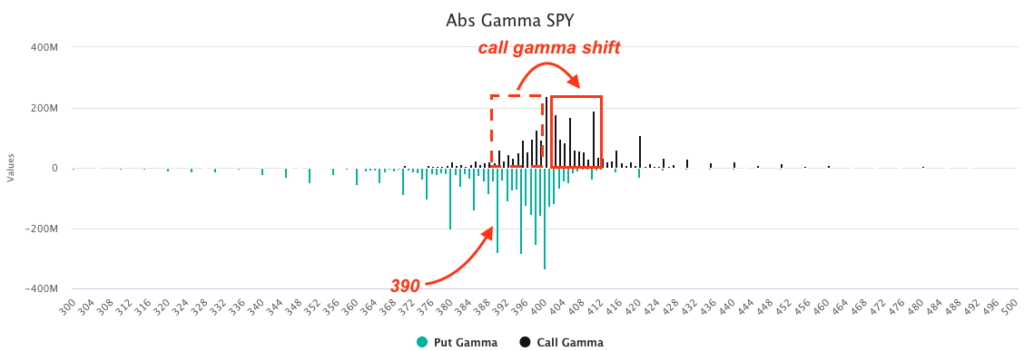
You may recall over the past several notes we highlighted the 3900’s as a neutral zone, with 3900 functioning as a major support line (blue shaded area, below). We still view 3900 as short term Put Wall support, but its much less convincing as longer term support.
This is for two key reasons:
- Calls in the 390’s SPY/3900’s SPX have been closed (as per red dashed box above)
- IV compression / lack of downside hedges
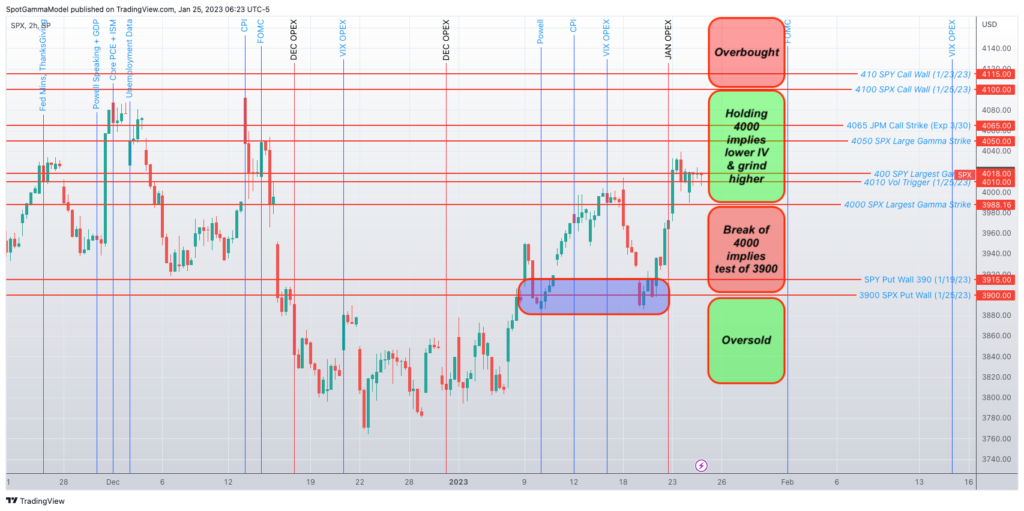
This results in price action in the 3900’s likely being very fluid, and if we test 3900 it may be more of a “dead cat bounce” level, as opposed to this longer term support area for mean reversion back into the 4000’s (as per the last several tests in blue).
Yesterday we discussed this idea of “short covering” as a major driver of the rally, and the market needing to consolidate some gains. There was no call follow through yesterday, which normally would just fit into the “consolidation” narrative.
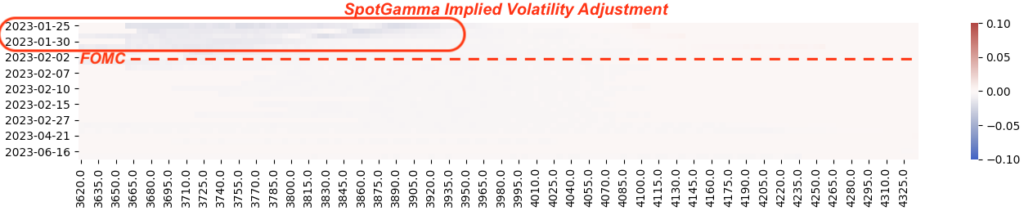
Further, you can see below that the predominant change in SPX implied volatility was put decay, particularly concentrated in pre-FOMC strikes. While traders didn’t reach for calls, put decay added support. Through this lens the market is not ready for a slide lower.
Enter the MSFT earnings, which have thrown some cold water on the bull parade. Added to this, if you were part of the equity call-chase Monday, you are feeling some pain yesterday and today. Plus, now, the decay of long calls is working against market upside due to vanna + charm (dealers short calls vs long stock, selling stock as calls decay).
In other words – it seems very hard for the rally to meaningfully restart before next weeks FOMC.
| SpotGamma Proprietary SPX Levels | Latest Data | SPX Previous | SPY | NDX | QQQ |
|---|---|---|---|---|---|
| Ref Price: | 4016 | 4020 | 400 | 11846 | 288 |
| SG Implied 1-Day Move:: | 1.08%, | (±pts): 43.0 | VIX 1 Day Impl. Move:1.22% | ||
| SG Implied 5-Day Move: | 2.86% | 3971 (Monday Ref Price) | Range: 3858.0 | 4085.0 | ||
| SpotGamma Gamma Index™: | 0.45 | 0.83 | -0.25 | 0.05 | -0.04 |
| Volatility Trigger™: | 4010 | 3970 | 401 | 11175 | 289 |
| SpotGamma Absolute Gamma Strike: | 4000 | 4000 | 400 | 11425 | 280 |
| Gamma Notional(MM): | 75.0 | 276.0 | -1254.0 | 5.0 | -273.0 |
| Put Wall: | 3900 | 3800 | 390 | 11000 | 280 |
| Call Wall : | 4100 | 4050 | 410 | 11425 | 295 |
| Additional Key Levels | Latest Data | Previous | SPY | NDX | QQQ |
|---|---|---|---|---|---|
| Zero Gamma Level: | 4013 | 3987 | 405.0 | 10735.0 | 310 |
| CP Gam Tilt: | 1.13 | 1.16 | 0.68 | 1.57 | 0.83 |
| Delta Neutral Px: | 3924 | ||||
| Net Delta(MM): | $1,347,629 | $1,406,045 | $155,089 | $45,508 | $80,383 |
| 25D Risk Reversal | -0.04 | -0.05 | -0.02 | -0.0 | -0.0 |
| Call Volume | 378,763 | 638,140 | 1,643,684 | 5,711 | 624,007 |
| Put Volume | 681,656 | 1,058,389 | 2,399,543 | 8,239 | 759,140 |
| Call Open Interest | 5,416,853 | 5,301,703 | 5,774,574 | 57,002 | 4,128,008 |
| Put Open Interest | 9,597,930 | 9,692,956 | 12,117,148 | 49,914 | 6,643,814 |
| Key Support & Resistance Strikes: |
|---|
| SPX: [4050, 4000, 3950, 3900] |
| SPY: [400, 398, 395, 390] |
| QQQ: [300, 290, 285, 280] |
| NDX:[12000, 11500, 11425, 11000] |
| SPX Combo (strike, %ile): [(4202.0, 93.79), (4173.0, 80.12), (4149.0, 92.06), (4125.0, 80.3), (4117.0, 74.84), (4101.0, 97.16), (4073.0, 93.43), (4065.0, 93.94), (4061.0, 79.4), (4049.0, 96.5), (4029.0, 84.78), (4025.0, 87.07), (3985.0, 85.73), (3977.0, 79.98), (3965.0, 82.75), (3949.0, 75.1), (3916.0, 86.39), (3900.0, 92.87), (3848.0, 83.64)] |
| SPY Combo: [408.6, 403.4, 405.0, 418.61, 405.8] |
| NDX Combo: [11420.0, 12119.0, 11503.0, 12001.0] |