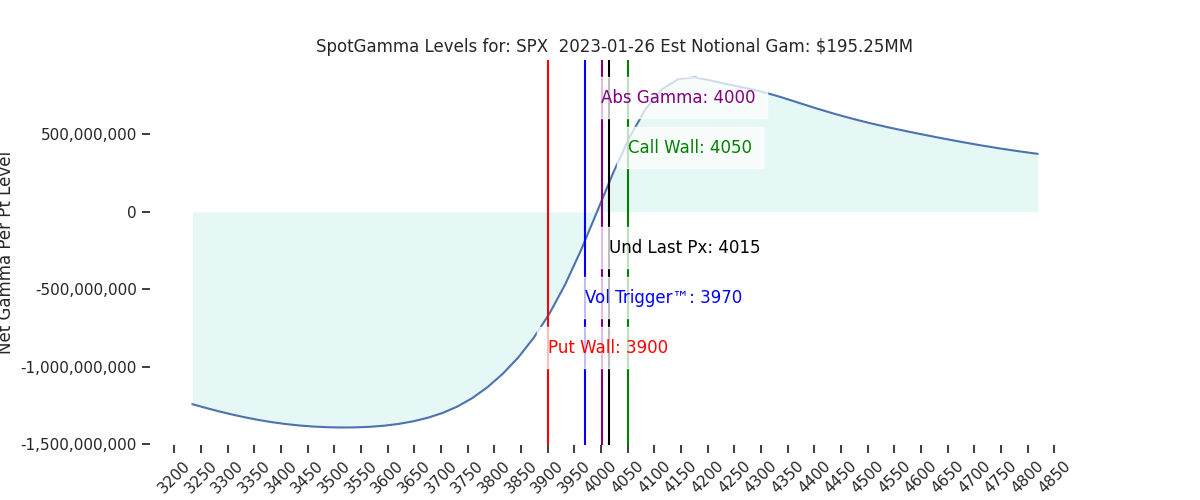
Futures are up to near overnight highs of 4041. Major resistance remains at the 4050 SPX Call Wall, followed by 405 SPY (4065 SPX). Support shows at 4015 (SPY 400) followed by 4000. Due to activity as yesteradys lows, we now see a larger support band from 3970 (Vol Trigger)/395SPY (3965SPX) to 3950 SPX.
The volume at SPX 4000 yesterday was very large: 95k puts and 150k calls. Total open interest changes at the 4000 strike: +26k puts and just +8k calls. It was a similar thing in SPY wherein 780k SPY 400 calls traded, and 650k SPY 395 puts traded. Open interest changes to those strikes were: 29k & 23k respectively.
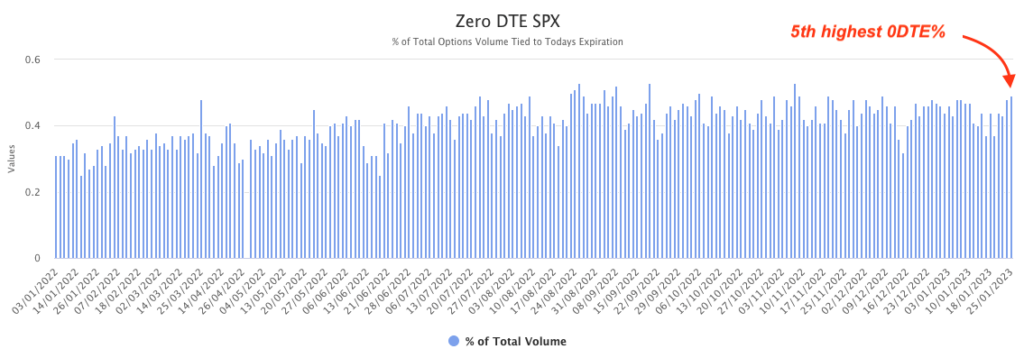
This ultra low open interest change for huge volume is a surefire sign of large 0DTE. To this point, yesterday was the 5th highest SPX 0DTE % reading over the past year.
This 0DTE comes in to help establish the daily low, and then turns into the momentum trade that pushes markets back higher. It stopped early weak sellers, and then created an afternoon chase. The point here is that we should likely treat price action with a grain of salt until the 2/1 FOMC.
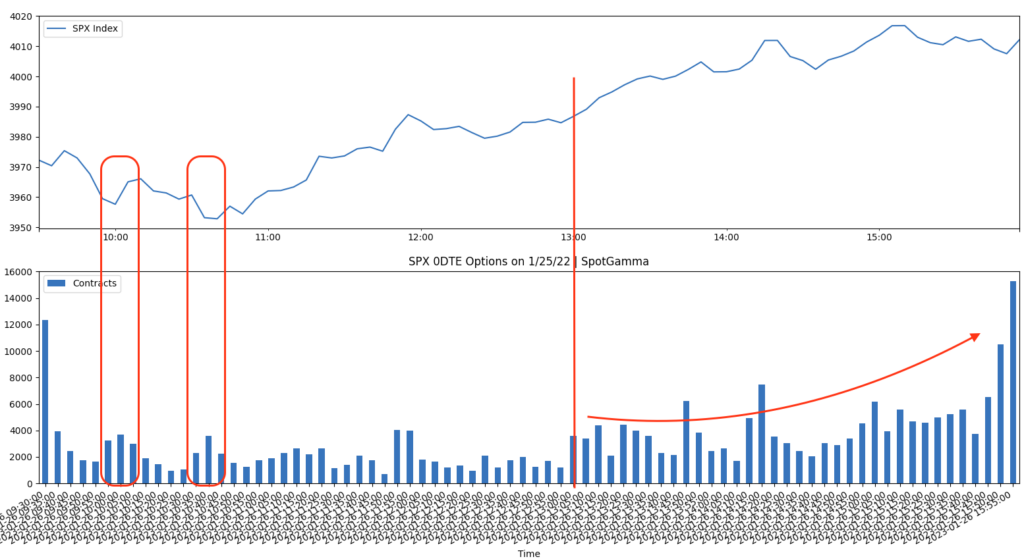
The evidence for this can be seen below, wherein we plotted the 0DTE contract volume (bottom) vs SPX index price (top) in 5 minute buckets (apologies for the crude chart). What you can see is waves of 0DTE options volumes as SPX was testing 3950 lows. We monitored this in real time as put volumes concentrated in the 3925-3950 area.
More interestingly, 0DTE volume appears to pick up substantially at 1pm ET. This was when the 5 year treasury auction fired off, and there was “stellar” demand. Based on this there is some evidence that the bond auction cleared the way for higher S&P prices, with 0DTE driving the ramp (the justification being that the bond market doesn’t read much higher rates going forward).
We’ve heard chatter of this link between the auctions and 0DTE before – and not given it much credence. Further this link is clearly anecdotal, but quite interesting, and something we’ll be monitoring going forward.
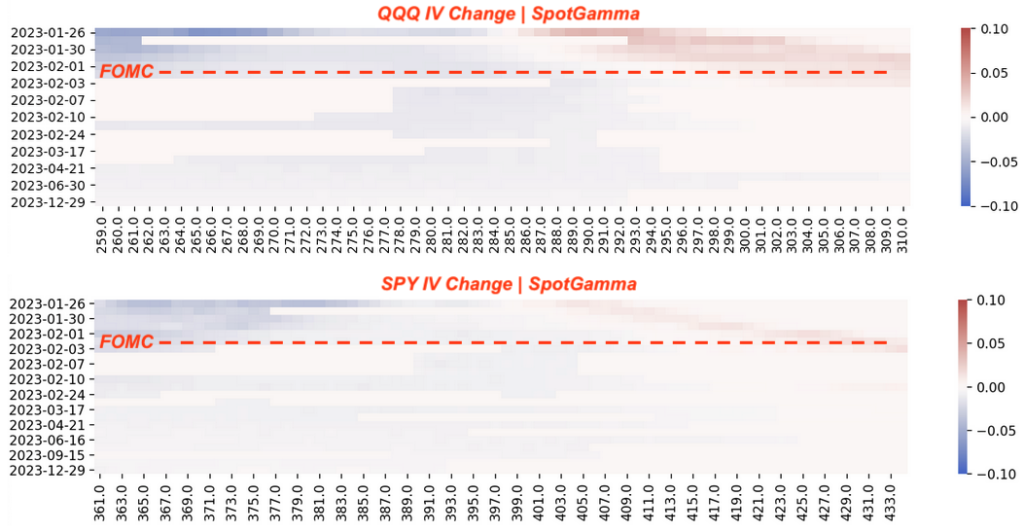
When you look at the overall “non 0DTE” picture of what changed yesterday the answer is “not much”. Shown below is the IV change for QQQ (top) vs SPY (bottom) and you can see that very short dated upside IV was bid suggesting some upside demand into FOMC. In the case of SPY that demand was there, but not as strong as indicated by the lighter red region in the top right.
One could see some evidence of an upside IV increase under the context of FOMC “right tail” hedging (seen as “heat” at upside strikes post-FOMC) which may tie back into the strong bond auction.
| SpotGamma Proprietary SPX Levels | Latest Data | SPX Previous | SPY | NDX | QQQ |
|---|---|---|---|---|---|
| Ref Price: | 4015 | 4010 | 400 | 11814 | 287 |
| SG Implied 1-Day Move:: | 1.08%, | (±pts): 43.0 | VIX 1 Day Impl. Move:1.2% | ||
| SG Implied 5-Day Move: | 2.86% | 3971 (Monday Ref Price) | Range: 3858.0 | 4085.0 | ||
| SpotGamma Gamma Index™: | 0.65 | 0.45 | -0.12 | 0.04 | 0.00 |
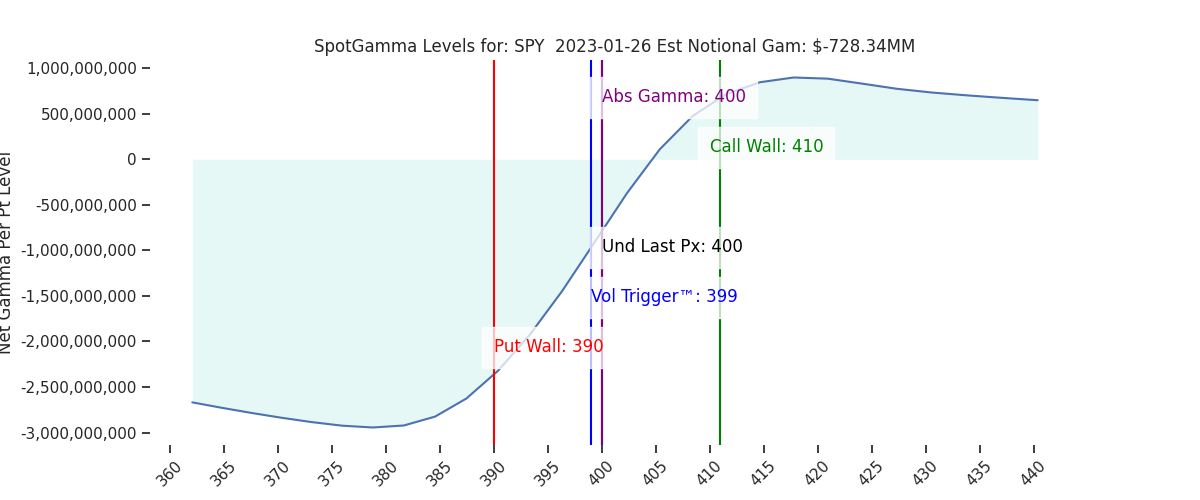
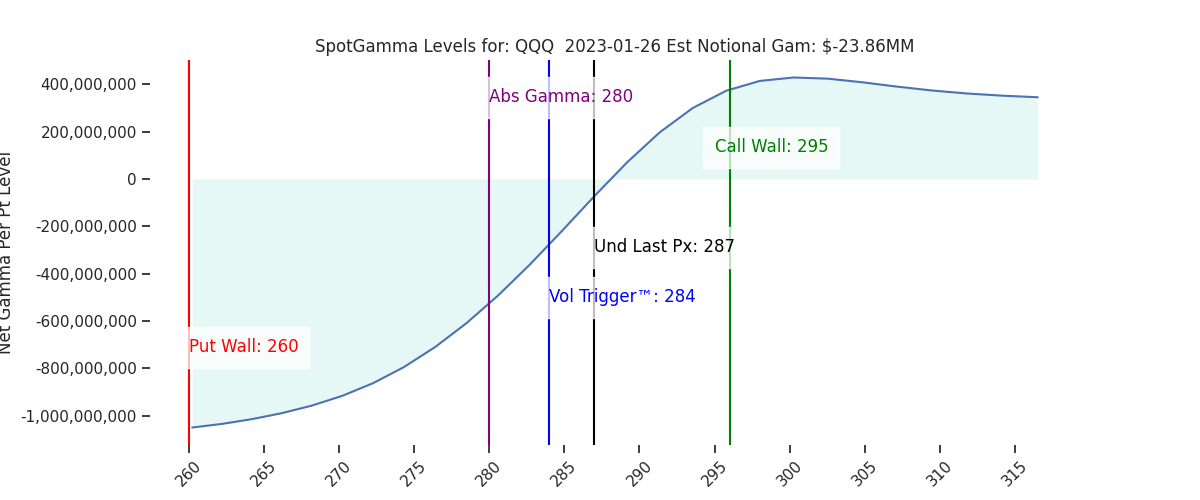
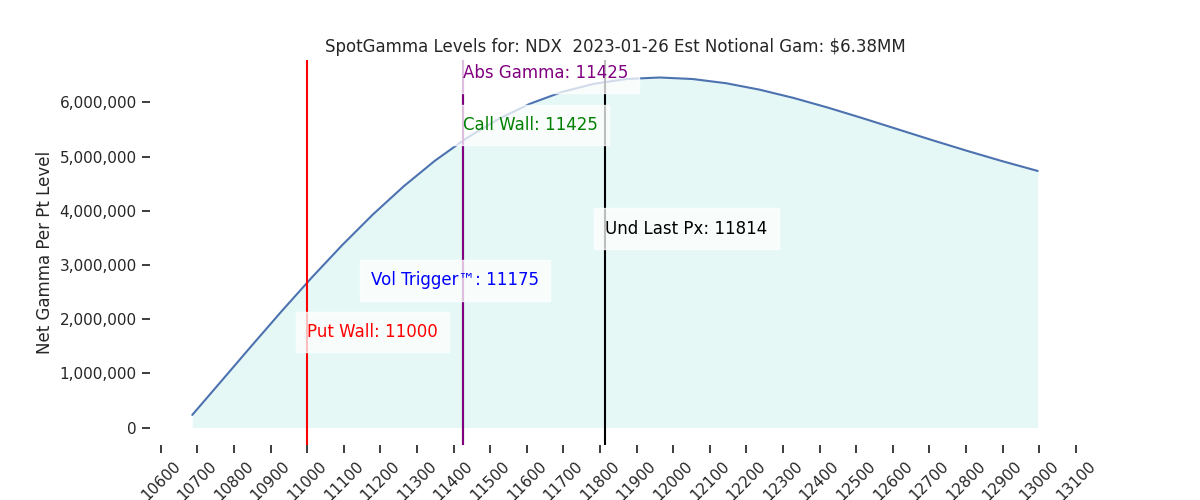
| Volatility Trigger™: | 3970 | 4010 | 399 | 11175 | 284 |
| SpotGamma Absolute Gamma Strike: | 4000 | 4000 | 400 | 11425 | 280 |
| Gamma Notional(MM): | 195.0 | 16.0 | -728.0 | 6.0 | -24.0 |
| Put Wall: | 3900 | 3900 | 390 | 11000 | 260 |
| Call Wall : | 4050 | 4100 | 410 | 11425 | 295 |
| Additional Key Levels | Latest Data | Previous | SPY | NDX | QQQ |
|---|---|---|---|---|---|
| Zero Gamma Level: | 4012 | 4007 | 402.0 | 0 | 307 |
| CP Gam Tilt: | 1.19 | 1.01 | 0.81 | 1.66 | 0.98 |
| Delta Neutral Px: | 3952 | ||||
| Net Delta(MM): | $1,439,430 | $1,345,439 | $162,036 | $50,949 | $84,065 |
| 25D Risk Reversal | -0.05 | -0.04 | -0.04 | 0.0 | -0.04 |
| Call Volume | 509,671 | 378,763 | 2,338,773 | 5,232 | 834,147 |
| Put Volume | 868,193 | 681,656 | 3,569,504 | 7,058 | 1,151,688 |
| Call Open Interest | 5,470,181 | 5,416,853 | 5,943,599 | 57,906 | 4,239,930 |
| Put Open Interest | 9,952,705 | 9,597,930 | 12,408,286 | 55,424 | 6,809,520 |
| Key Support & Resistance Strikes: |
|---|
| SPX: [4050, 4000, 3950, 3900] |
| SPY: [402, 400, 398, 395] |
| QQQ: [300, 290, 285, 280] |
| NDX:[12000, 11700, 11500, 11425] |
| SPX Combo (strike, %ile): [(4200.0, 94.19), (4176.0, 81.44), (4148.0, 92.75), (4124.0, 79.09), (4112.0, 77.24), (4100.0, 97.55), (4080.0, 75.35), (4076.0, 93.07), (4064.0, 91.45), (4060.0, 90.15), (4048.0, 97.45), (4040.0, 76.13), (4028.0, 86.78), (4024.0, 90.7), (4020.0, 75.48), (4000.0, 86.09), (3963.0, 78.19), (3951.0, 78.48), (3931.0, 77.28), (3911.0, 87.39), (3899.0, 93.71), (3851.0, 86.55)] |
| SPY Combo: [408.76, 403.55, 418.77, 388.74, 406.36] |
| NDX Combo: [11425.0, 12110.0, 11909.0, 11496.0] |