
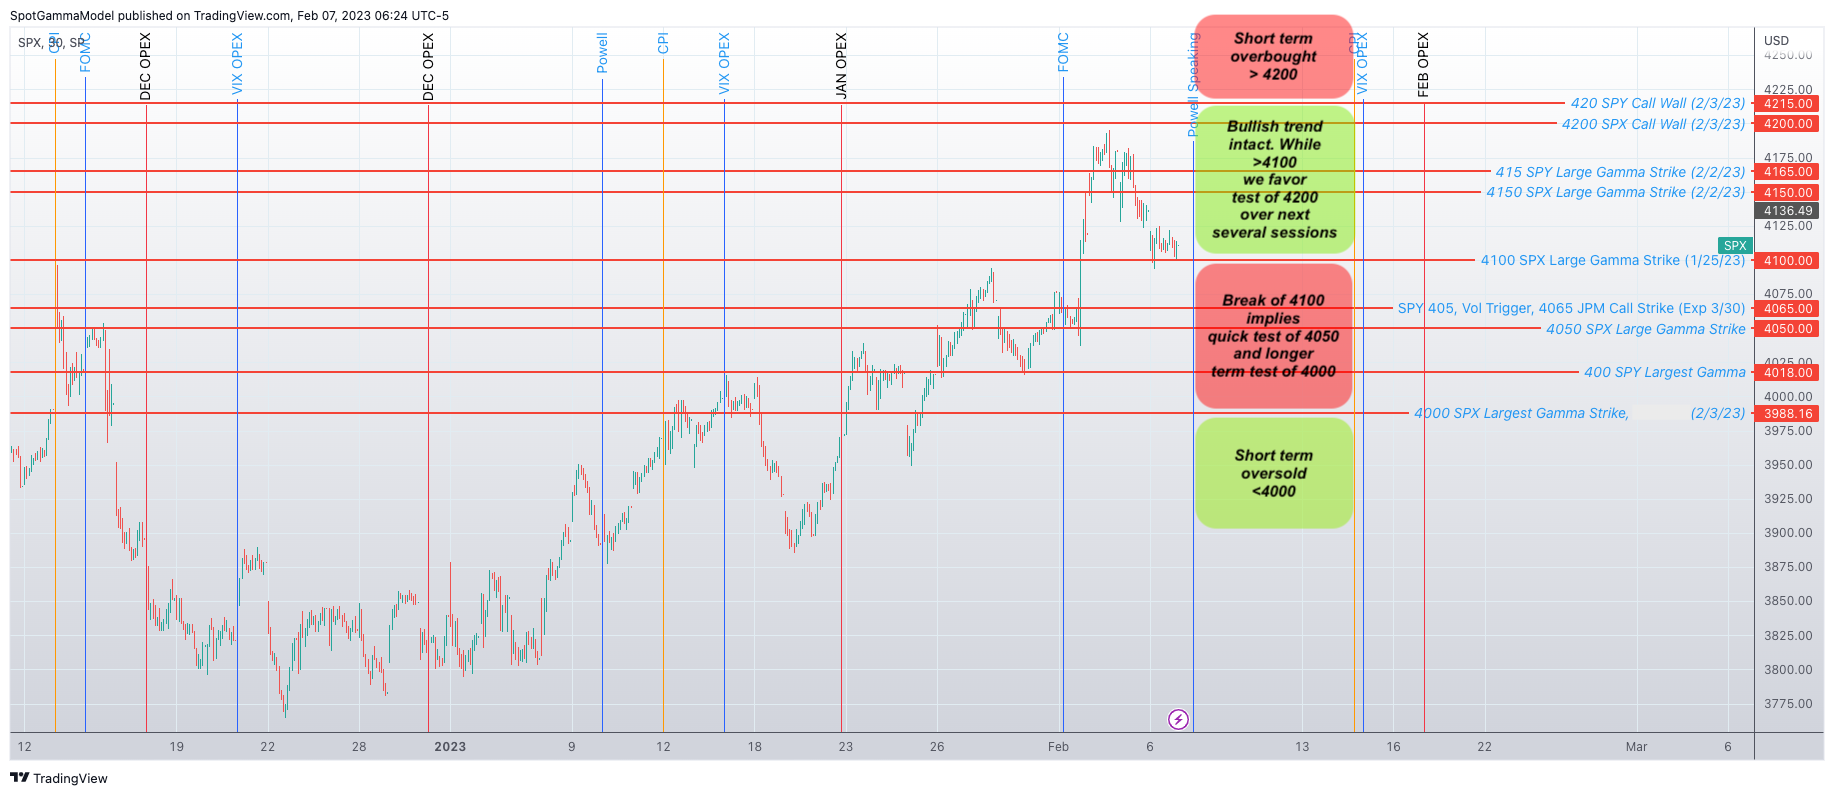
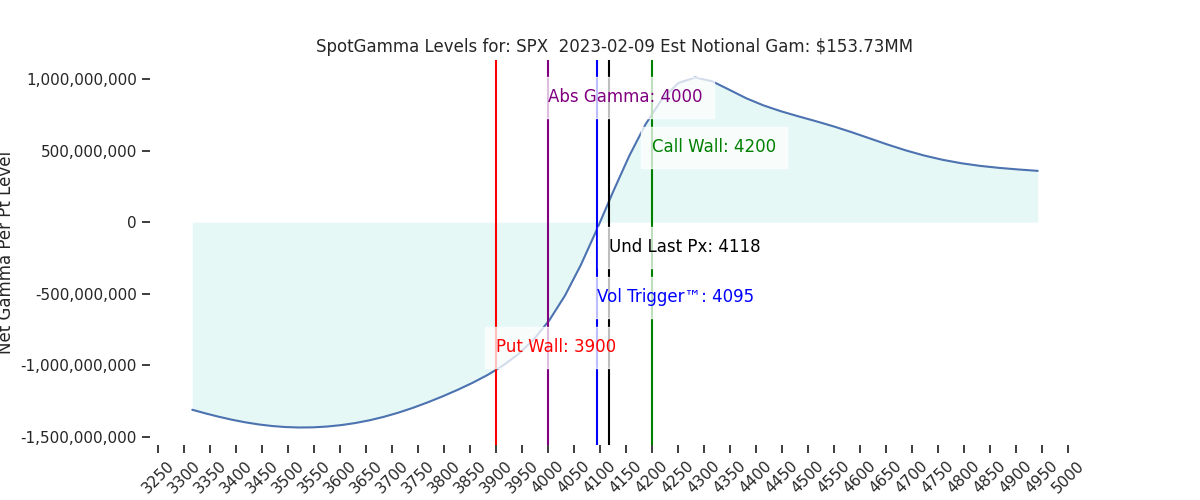
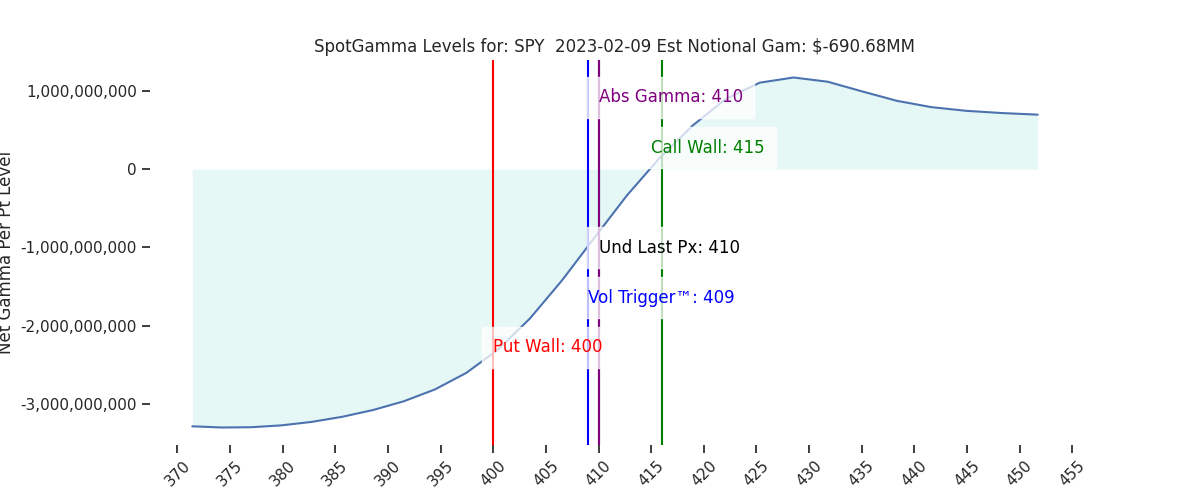
Futures have popped higher to 4165. Jobless claims are at 8:30AM ET, which may cause some initial volatility. Yesterday we saw the SPY Call Wall shift to 415 (4165 SPX), which reinforces the strength of this level as first resistance. The 4200 SPX Call Wall remains our maximum high. To the downside we continue to see the 4115 (SPY 410) – 4100 SPX range as major support. A break of 4100 likely invokes a test of 4060.
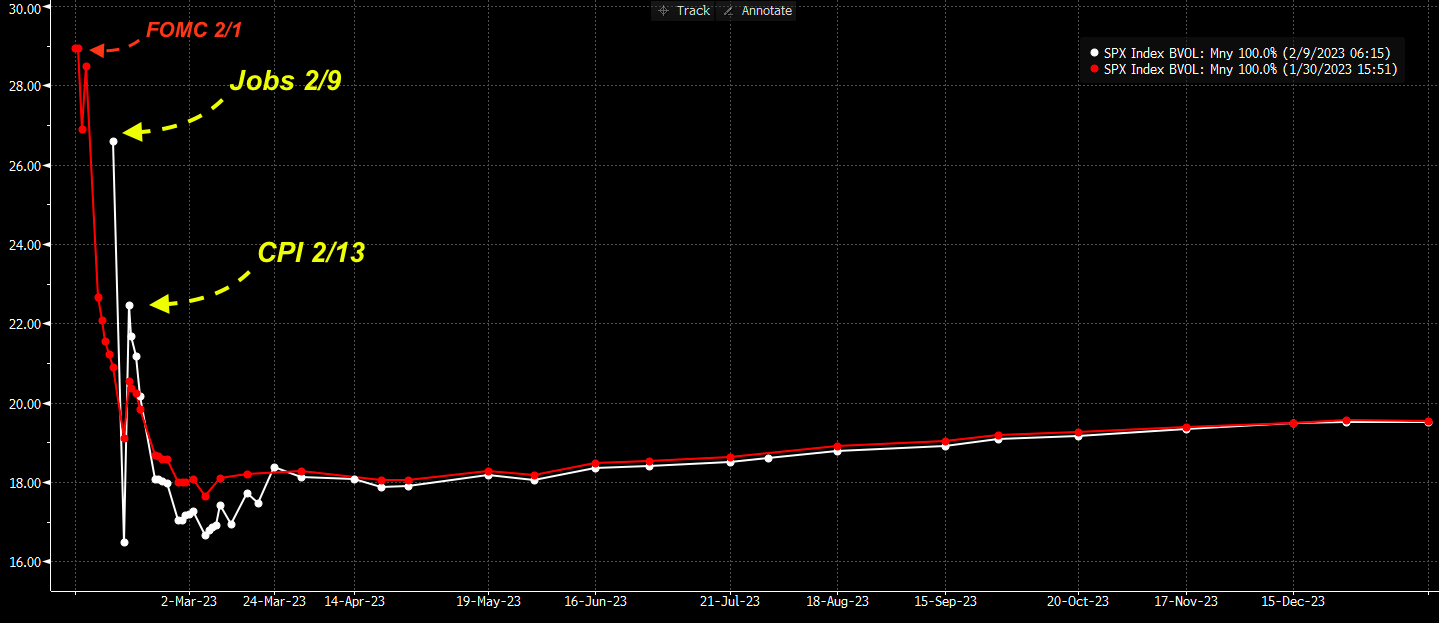
The options market continues to assign relatively high volatility to this mornings Jobs number, and next weeks CPI. We are not at the extreme IV’s of mid December CPI/FOMC (screenshot here), but traders are still weary that these data points will change narratives and move markets. It also continues to imply that traders are still data dependent, and not comfortable with rate projections (as in: “If we are done hiking then why do you care what the jobs number is?”).
Ultimately we are still of the opinion that the SPX holds the 4100-4200 range for today and into tomorrow.
Turning slightly, we received a large number of inquires into two, linked points:
- Spike in the VVIX
- Large 25k ES 2/17 4050 put buyer – allegedly Carl Icahn. Note we only see a change of 18k OI at that strike for today.
First, in regards to the 4050 ES puts: As long as the SPX holds our key 4100 level, these puts will lie fairly dormant with little market impact. Note even though they are short dated, they will likely not significantly decay until Tuesdays AM CPI print.
However, in line with our “bear triggers” (a break of 4100 and the opening of OPEX weakness) these options likely invigorate volatility to the downside, particularly post CPI. This is because under 4100 they add negative gamma that apex’s at 4050 into Friday.
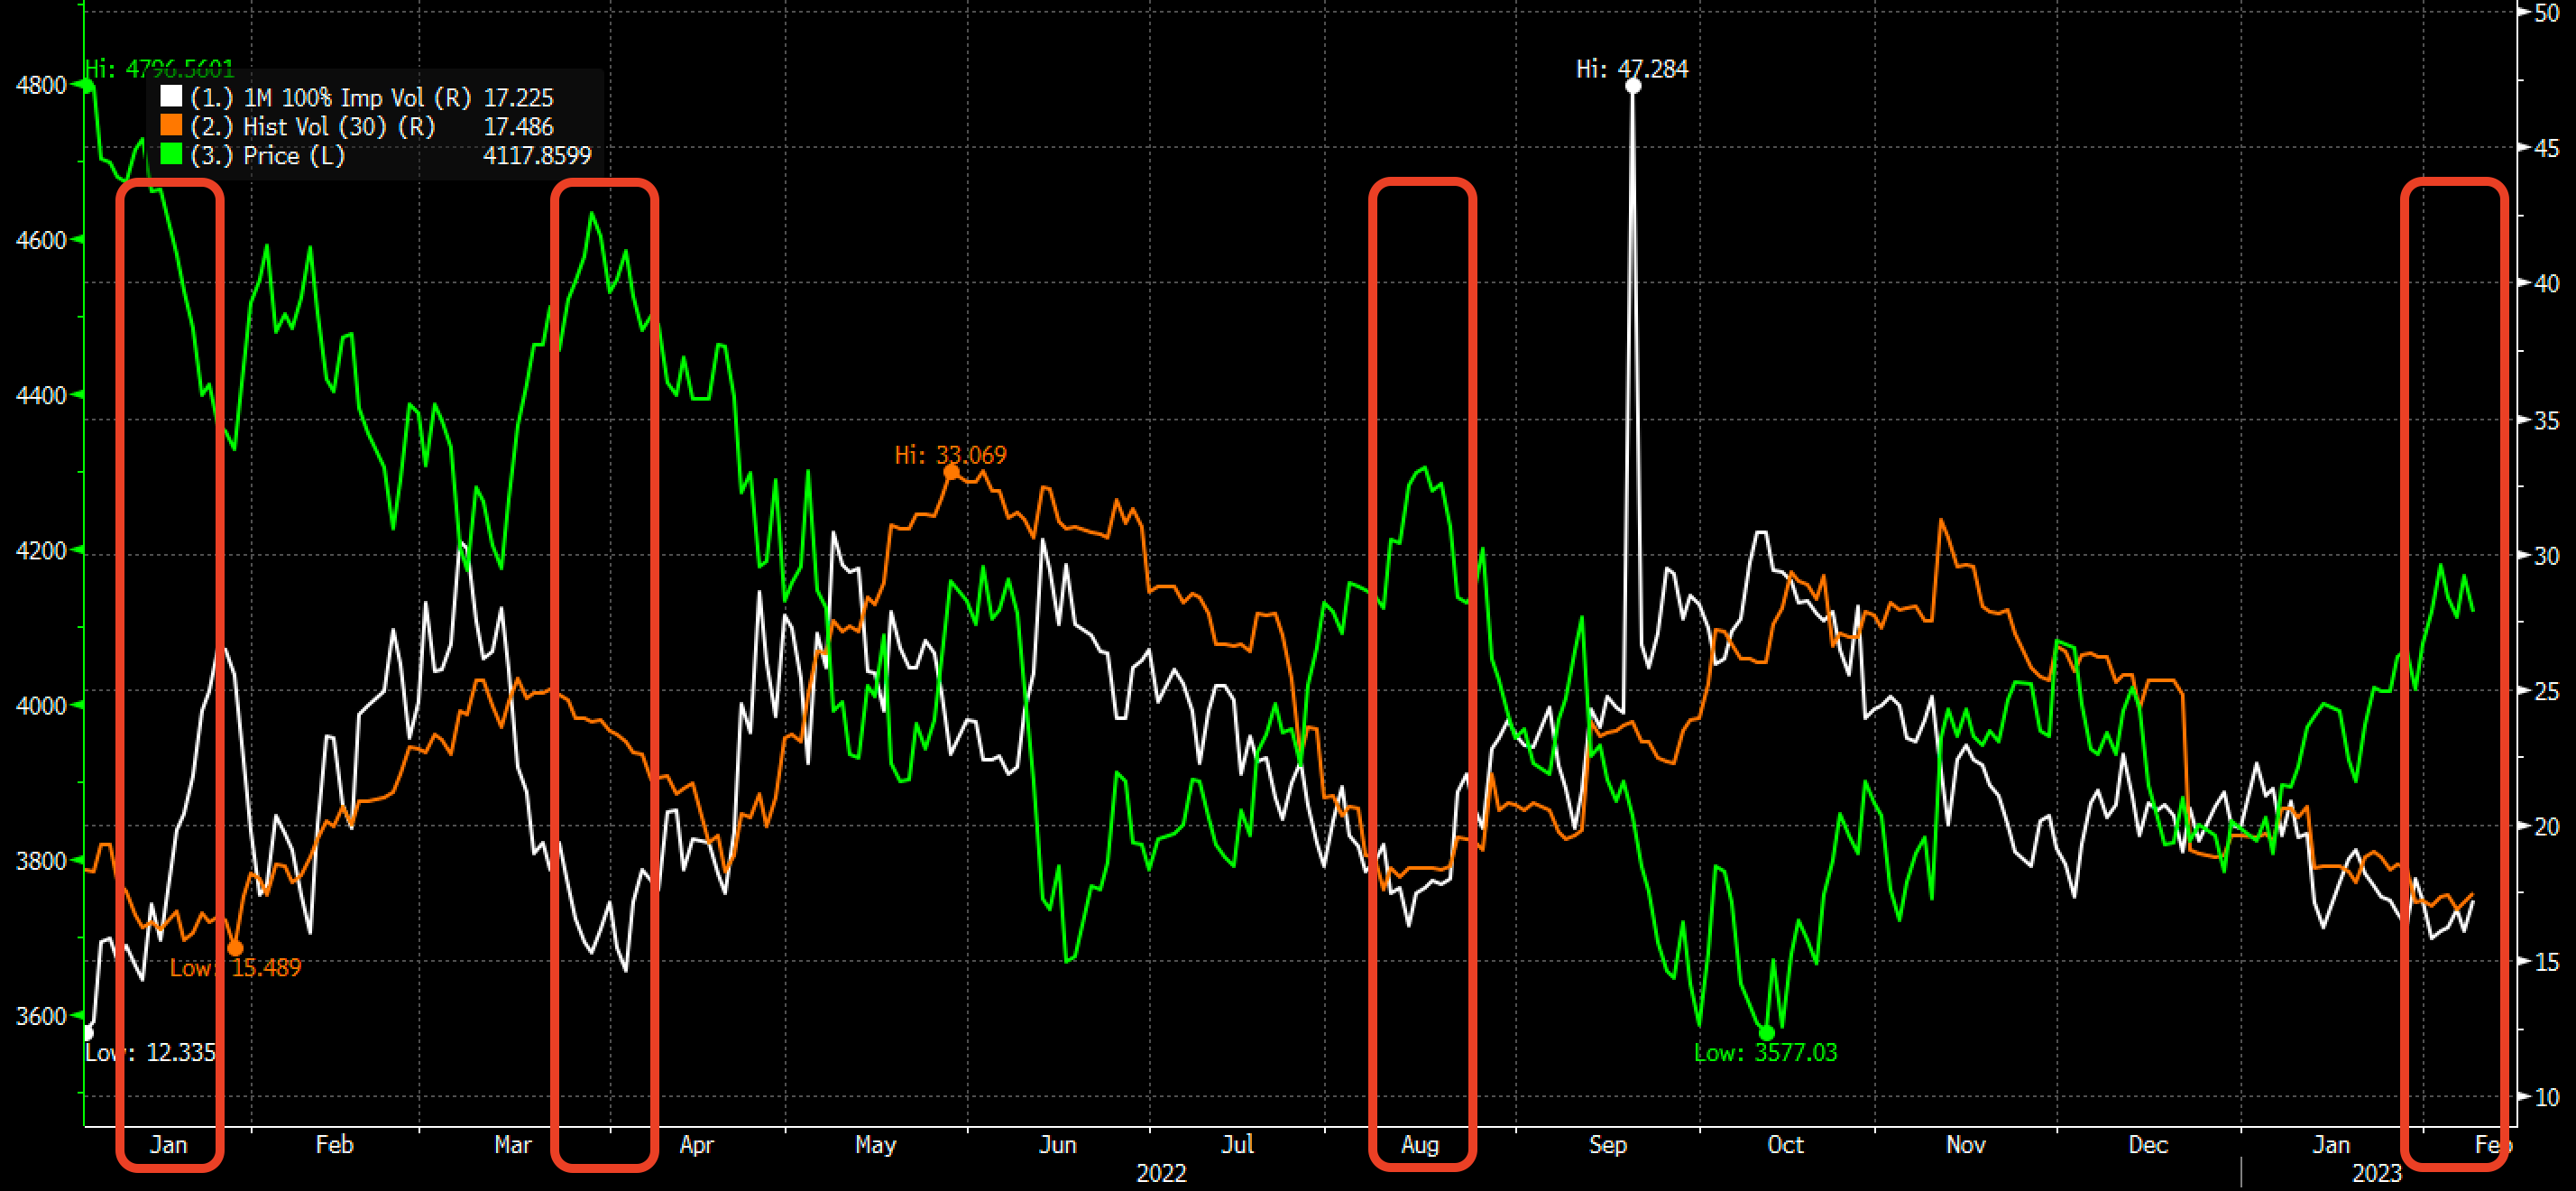
The other area that received a lot of attention yesterday was the pop in VVIX, which should be fairly unsurprising to readers of SpotGamma. We have been under this regime of IV compression as discussed here. Realized volatility is not declining as markets have rallied, and are threatening to peak. Despite this, implied volatility has come down sharply, and so the spread between IV/RV has collapsed. From this standpoint one could argue that IV’s path of least resistance is higher.
Shown below is the SPX (green) vs 30 day IV (white) vs 30 day RV (orange). As you can see over the past year when IV/RV compress at lows, it has market major highs in the SPX.
The idea at this time was that the recent FOMC may usher in this period of calm, which could allow realized volatility to decline – and subsequently implied volatility. Instead what seems to be happening is the market now “really needs to see this next jobs/CPI/etc” do be convinced things are all clear. Instead, RV isn’t dropping, and we are seeing some fairly large hedges hit the market (like the ES trade from above).
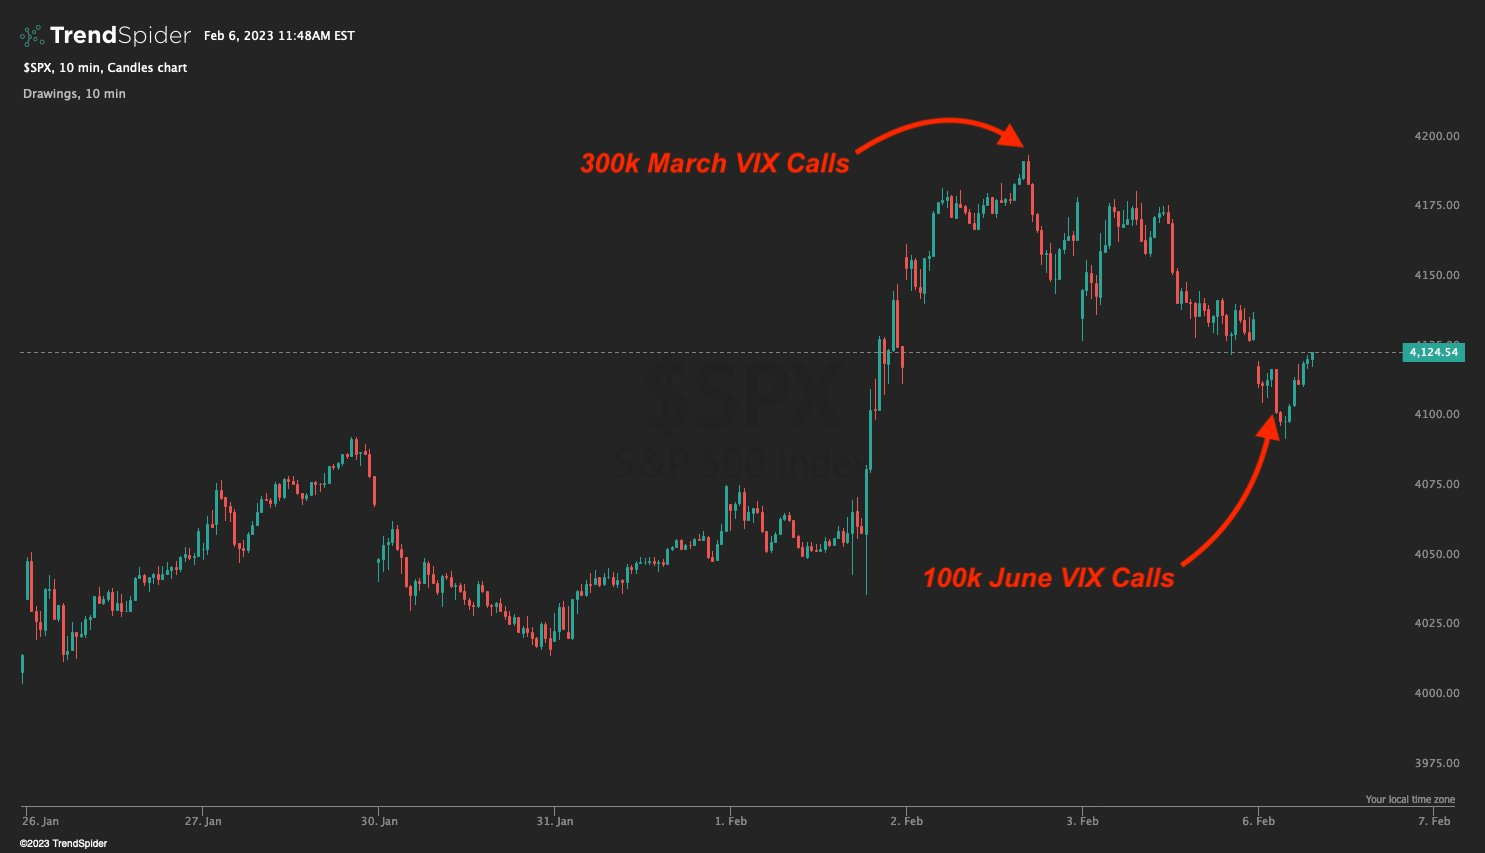
In addition, we’ve been seeing several large VIX call trades over the past week, as shown below. This fuels VVIX, which is just VIX skew.
This all circles back to the key ranges we have been outlining, and the importance of the risk window opening at 2/13 or on a break of 4100. We feel that traders who are betting on downside *today* are fighting a lot of positive gamma in the 4100-4200 area, and resistance releases into OPEX.
To the upside we will likely see markets first stage at 4200 (rather than blow through it). Should we stage at 4200 and then see Call Walls roll higher, its our signal that more upside is “available” to the S&P.
| SpotGamma Proprietary SPX Levels | Latest Data | SPX Previous | SPY | NDX | QQQ |
|---|---|---|---|---|---|
| Ref Price: | 4118 | 4124 | 410 | 12495 | 304 |
| SG Implied 1-Day Move:: | 1.28%, | (±pts): 44.0 | VIX 1 Day Impl. Move:1.23% | ||
| SG Implied 5-Day Move: | 2.85% | 4136 (Monday Ref Price) | Range: 4019.0 | 4254.0 | ||
| SpotGamma Gamma Index™: | .52 | 1.26 | -0.13 | 0.05 | -0.02 |
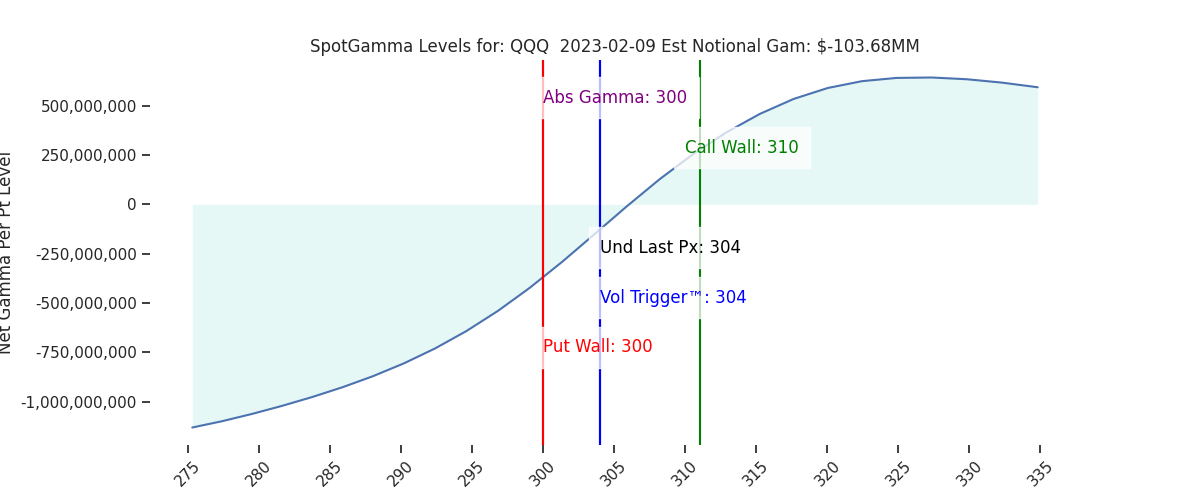
| Volatility Trigger™: | 4000 | 4060 | 409 | 11225 | 304 |
| SpotGamma Absolute Gamma Strike: | 4000 | 4000 | 410 | 13000 | 300 |
| Gamma Notional(MM): | 154.0 | 218.0 | -691.0 | 7.0 | -104.0 |
| Put Wall: | 3900 | 4000 | 400 | 10500 | 300 |
| Call Wall : | 4200 | 4200 | 415 | 11425 | 310 |
| Additional Key Levels | Latest Data | Previous | SPY | NDX | QQQ |
|---|---|---|---|---|---|
| Zero Gamma Level: | 4073 | 4079 | 413.0 | 0 | 316 |
| CP Gam Tilt: | 1.13 | 1.11 | 0.83 | 1.69 | 0.94 |
| Delta Neutral Px: | 4023 | ||||
| Net Delta(MM): | $1,684,844 | $1,596,451 | $188,110 | $64,328 | $105,464 |
| 25D Risk Reversal | -0.05 | -0.06 | -0.04 | -0.04 | -0.04 |
| Call Volume | 518,715 | 534,166 | 2,154,367 | 5,407 | 778,908 |
| Put Volume | 839,537 | 818,329 | 2,538,742 | 6,327 | 921,331 |
| Call Open Interest | 4,918,239 | 5,656,384 | 6,537,387 | 68,722 | 4,924,003 |
| Put Open Interest | 8,762,064 | 10,822,585 | 14,405,977 | 65,415 | 8,271,614 |
| Key Support & Resistance Strikes: |
|---|
| SPX: [4200, 4100, 4000, 3900] |
| SPY: [415, 410, 405, 400] |
| QQQ: [310, 305, 300, 290] |
| NDX:[13000, 12500, 12000, 11425] |
| SPX Combo (strike, %ile): [(4300.0, 95.16), (4275.0, 82.04), (4250.0, 92.13), (4225.0, 75.65), (4201.0, 92.22), (4176.0, 80.14), (4164.0, 79.13), (4151.0, 90.05), (4065.0, 83.37), (4011.0, 80.76), (3999.0, 83.37), (3949.0, 82.24)] |
| SPY Combo: [428.72, 418.86, 423.79, 413.94, 398.74] |
| NDX Combo: [12720.0, 12320.0, 12933.0, 12495.0, 11908.0] |

0 comentarios