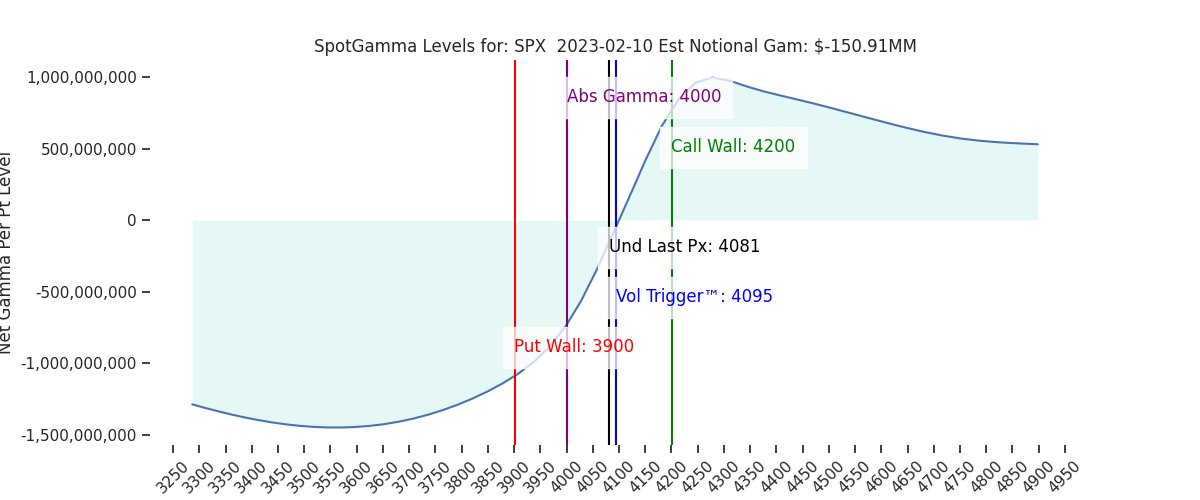
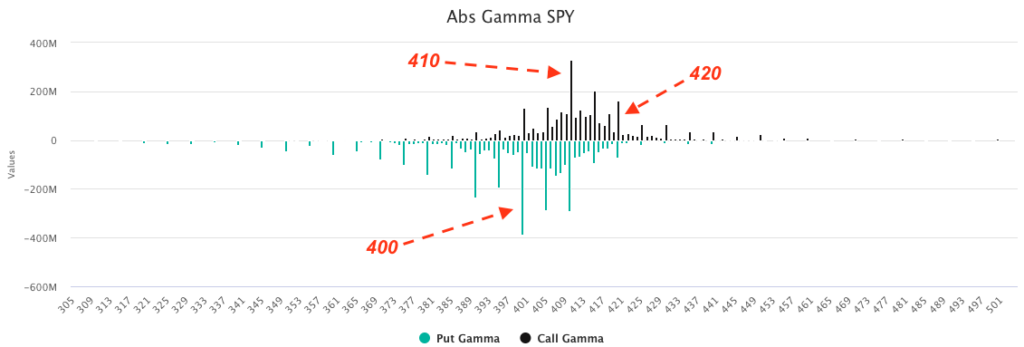
Futures have continued lower to 4065. First support shows at 4065 (SPY 405) – 4050. Below there, 4000 is a very large support strike. Resistance above shows at 4100-4115 (SPY 410).
TLDR: 4000 is significant support for today, however we assign edge to a retest of 4100.
While 4100-4200 was a positive gamma range drawing mean reversion flow(s), we think 4000-4100 is predominantly a negative gamma range which should elicit high volatility. This is true not only to the downside, but also the upside.
Long downside hedge positions have recently come into the market, and they are being energized not only by lower market prices, but also the shift higher in IV. This combination (price+IV) energized these puts, driving their values higher and drawing larger short hedging flows.
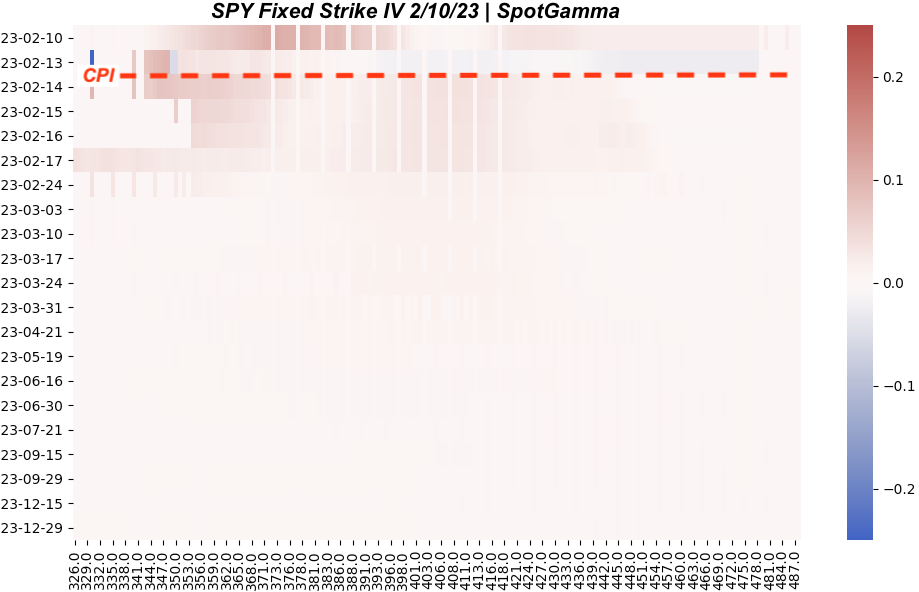
Shown below is implied volatility for SPY, and as you can see IV has increased across the board post CPI expirations. Shades of red imply traders are entering long vol positions, and we see that not only with downside strikes, but also upside. Further, we note that despite yesterdays weakness, the IV for 2/13 (Monday) expiration seemed to decrease (blue coloring). Traders are positioning now for CPI volatility.
However, the CPI catalyst isn’t until Tuesday AM. So to sustain the downside momentum bears need fresh hedging/selling to come into the market today. This is because IV is now up rather sharply, and so a pause in downside price action immediately starts to decay highly energized, short dated puts. This likely draws dealer-buying flows. If dealer buying kicks in as a result of vanna, then market prices rise, which draws more hedge short covering (gamma).
This feedback loop initiated by a “pause” is why we favor a retest of $4,100 for today.
Regarding the downside, we think it’s unlikely markets break 4000 into Monday, as it is a very large gamma strike which should draw large, supportive hedging flows.
A sustained selloff pre-CPI to 4000 also complicates the OPEX picture. This is because most of the call positions are locked in 4100-4200 area, and so the move lower now decays these call values pre-OPEX. This move lower, in a way, pulls forward that call decay. Therefore heading into CPI with the S&P around 4000 makes OPEX flows even more path-dependent on the CPI reaction.
| SpotGamma Proprietary SPX Levels | Latest Data | SPX Previous | SPY | NDX | QQQ |
|---|---|---|---|---|---|
| Ref Price: | 4081 | 4093 | 407 | 12381 | 301 |
| SG Implied 1-Day Move:: | 0.97%, | (±pts): 40.0 | VIX 1 Day Impl. Move:1.31% | ||
| SG Implied 5-Day Move: | 2.85% | 4136 (Monday Ref Price) | Range: 4019.0 | 4254.0 | ||
| SpotGamma Gamma Index™: | 0.09 | 0.51 | -0.29 | 0.01 | -0.05 |
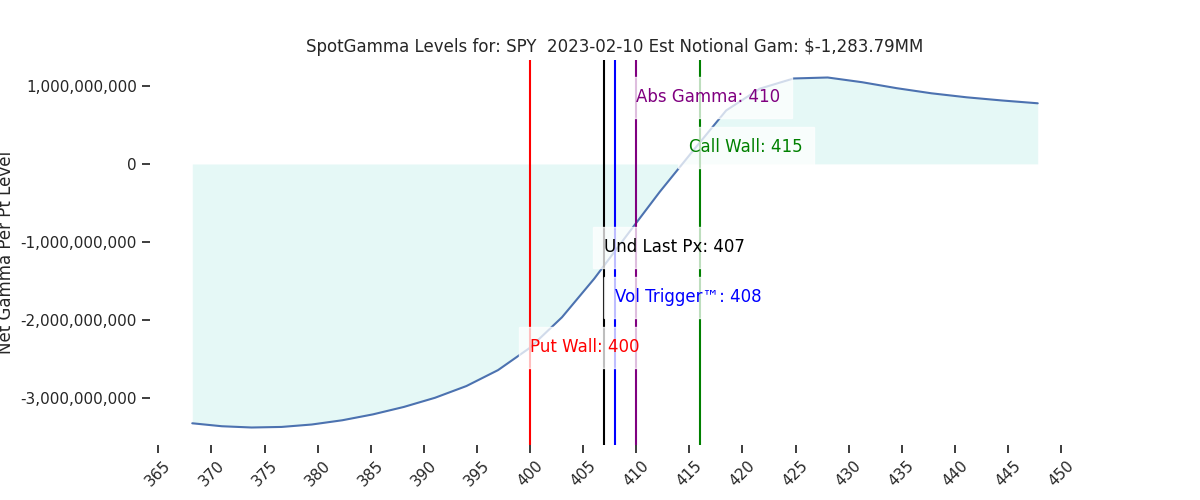
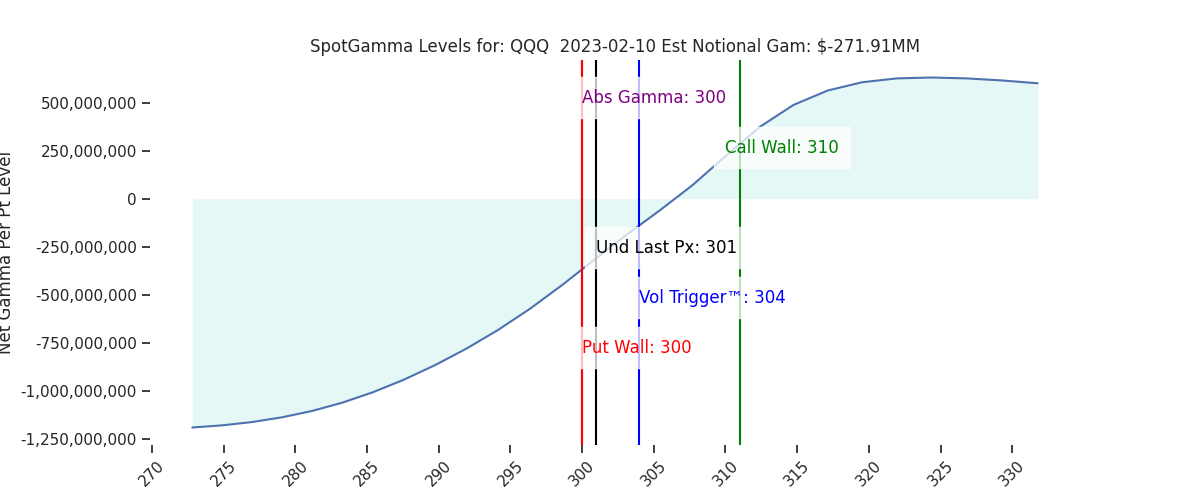
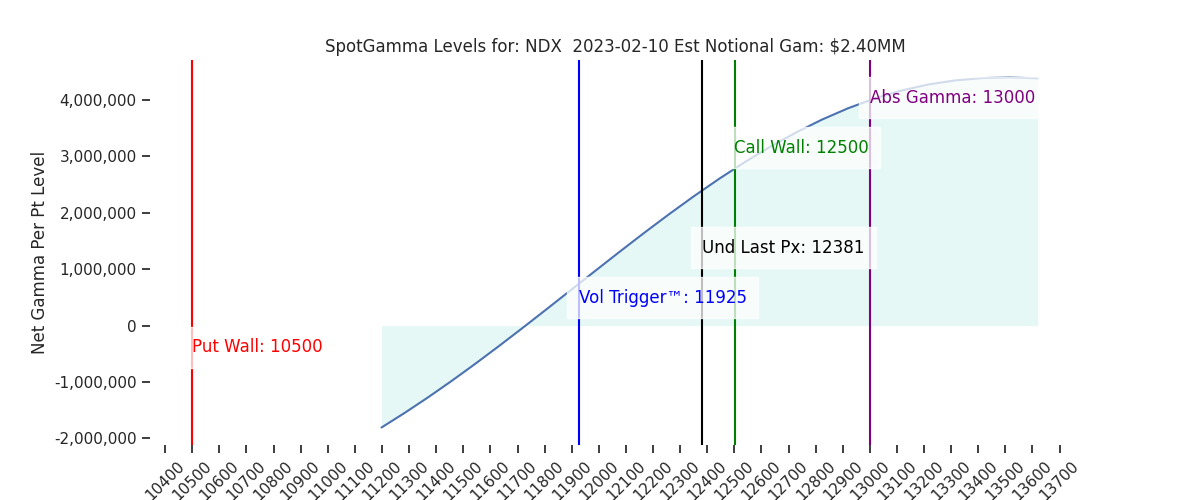
| Volatility Trigger™: | 4095 | 4095 | 408 | 11925 | 304 |
| SpotGamma Absolute Gamma Strike: | 4000 | 4000 | 410 | 13000 | 300 |
| Gamma Notional(MM): | -151.0 | -54.0 | -1284.0 | 2.0 | -272.0 |
| Put Wall: | 3900 | 3900 | 400 | 10500 | 300 |
| Call Wall : | 4200 | 4200 | 415 | 12500 | 310 |
| Additional Key Levels | Latest Data | Previous | SPY | NDX | QQQ |
|---|---|---|---|---|---|
| Zero Gamma Level: | 4098 | 4080 | 412.0 | 11726.0 | 315 |
| CP Gam Tilt: | 1.02 | 0.97 | 0.71 | 1.28 | 0.85 |
| Delta Neutral Px: | 4017 | ||||
| Net Delta(MM): | $1,603,069 | $1,674,796 | $192,284 | $43,944 | $106,686 |
| 25D Risk Reversal | -0.06 | -0.05 | -0.04 | -0.04 | -0.04 |
| Call Volume | 486,904 | 518,715 | 2,504,390 | 5,764 | 798,578 |
| Put Volume | 852,962 | 839,537 | 2,975,031 | 6,839 | 1,134,364 |
| Call Open Interest | 6,062,497 | 5,989,387 | 6,676,006 | 49,877 | 4,986,216 |
| Put Open Interest | 10,902,221 | 10,979,990 | 14,597,135 | 53,276 | 8,416,388 |
| Key Support & Resistance Strikes: |
|---|
| SPX: [4150, 4100, 4050, 4000] |
| SPY: [415, 410, 405, 400] |
| QQQ: [305, 300, 290, 285] |
| NDX:[13000, 12500, 12000, 11500] |
| SPX Combo (strike, %ile): [(4274.0, 82.82), (4249.0, 93.17), (4225.0, 87.5), (4200.0, 96.08), (4192.0, 75.52), (4176.0, 91.14), (4159.0, 80.99), (4151.0, 95.95), (4127.0, 82.56), (4102.0, 85.47), (4065.0, 83.39), (4061.0, 88.55), (4049.0, 89.29), (4041.0, 85.9), (4012.0, 86.43), (4000.0, 85.21), (3959.0, 84.0), (3951.0, 92.79), (3910.0, 85.38), (3902.0, 94.06)] |
| SPY Combo: [418.9, 414.01, 389.18, 423.78, 394.06] |
| NDX Combo: [12307.0, 12728.0, 11898.0, 12926.0] |