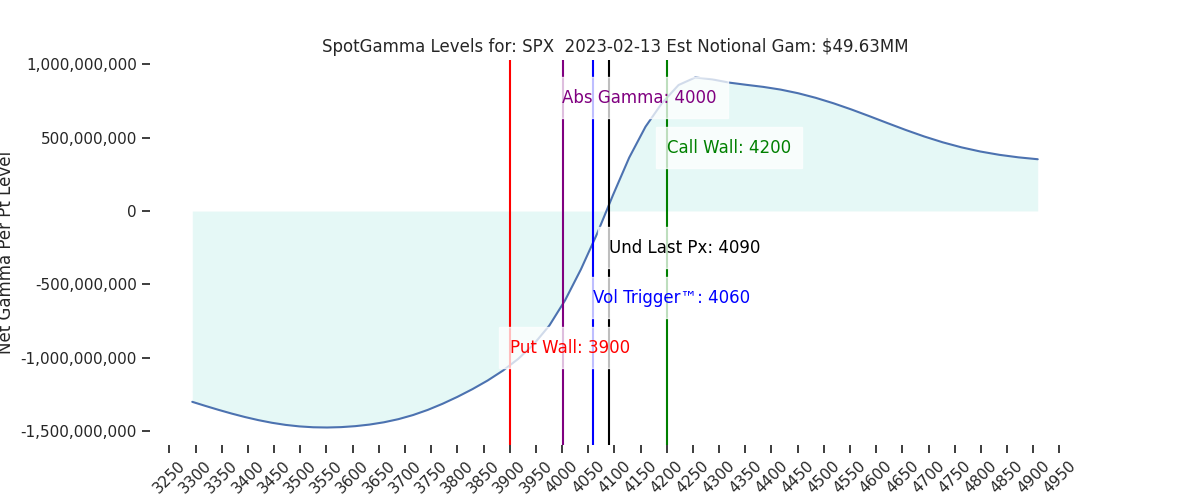
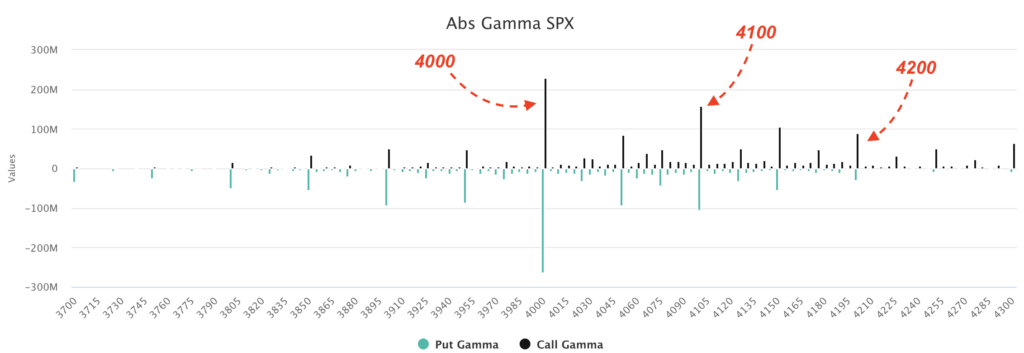
The 2 key areas we are now watching are 4000 to the downside, and 4200 to the upside. We anticipate one of those two levels being tested out of tomorrows CPI.
Friday’s monthly OPEX is not an overwhelmingly large expiration (~20% of total S&P gamma expiring), and is quite neutral in terms of put/call balance. This is backed by the proximity of current market prices to the Vol Trigger and ZeroGamma strikes (4060/4075).
There is clearly less volatility tied to tomorrows CPI (white) vs Jan (green) & Decembers (red), and you can see that reflected in the term structure below. Currently, expirations out past CPI carry a lower relative IV vs both previous data prints.

What seems to be more noticeably different here is skew, wherein there is less of a concern for the right tail. This is reflected in skew, wherein the IV for upside strikes is clearly lower vs Jan/December. Also, as you recall, many were forecasting vicious rallies after both the Dec & Jan CPI prints. However today it seems that bullish outlooks are much less aggressive, but there seems to be a similar level of left tail/deep downside pricing.

What we find most interesting in all of this is that the SPX is at the exact same level today as the 12/12 CPI high (a high which faded violently). That December print was followed up by an aggressive FOMC, which is not the case here (i.e. no FOMC tomorrow).
It seems to us that many now think the Fed is on the path of policy deescalation, yet we sit at the same S&P price (with QQQ only 1% above that Dec high) – and traders seem less concerned about hedging an upside surprise (but have been hedging downside).
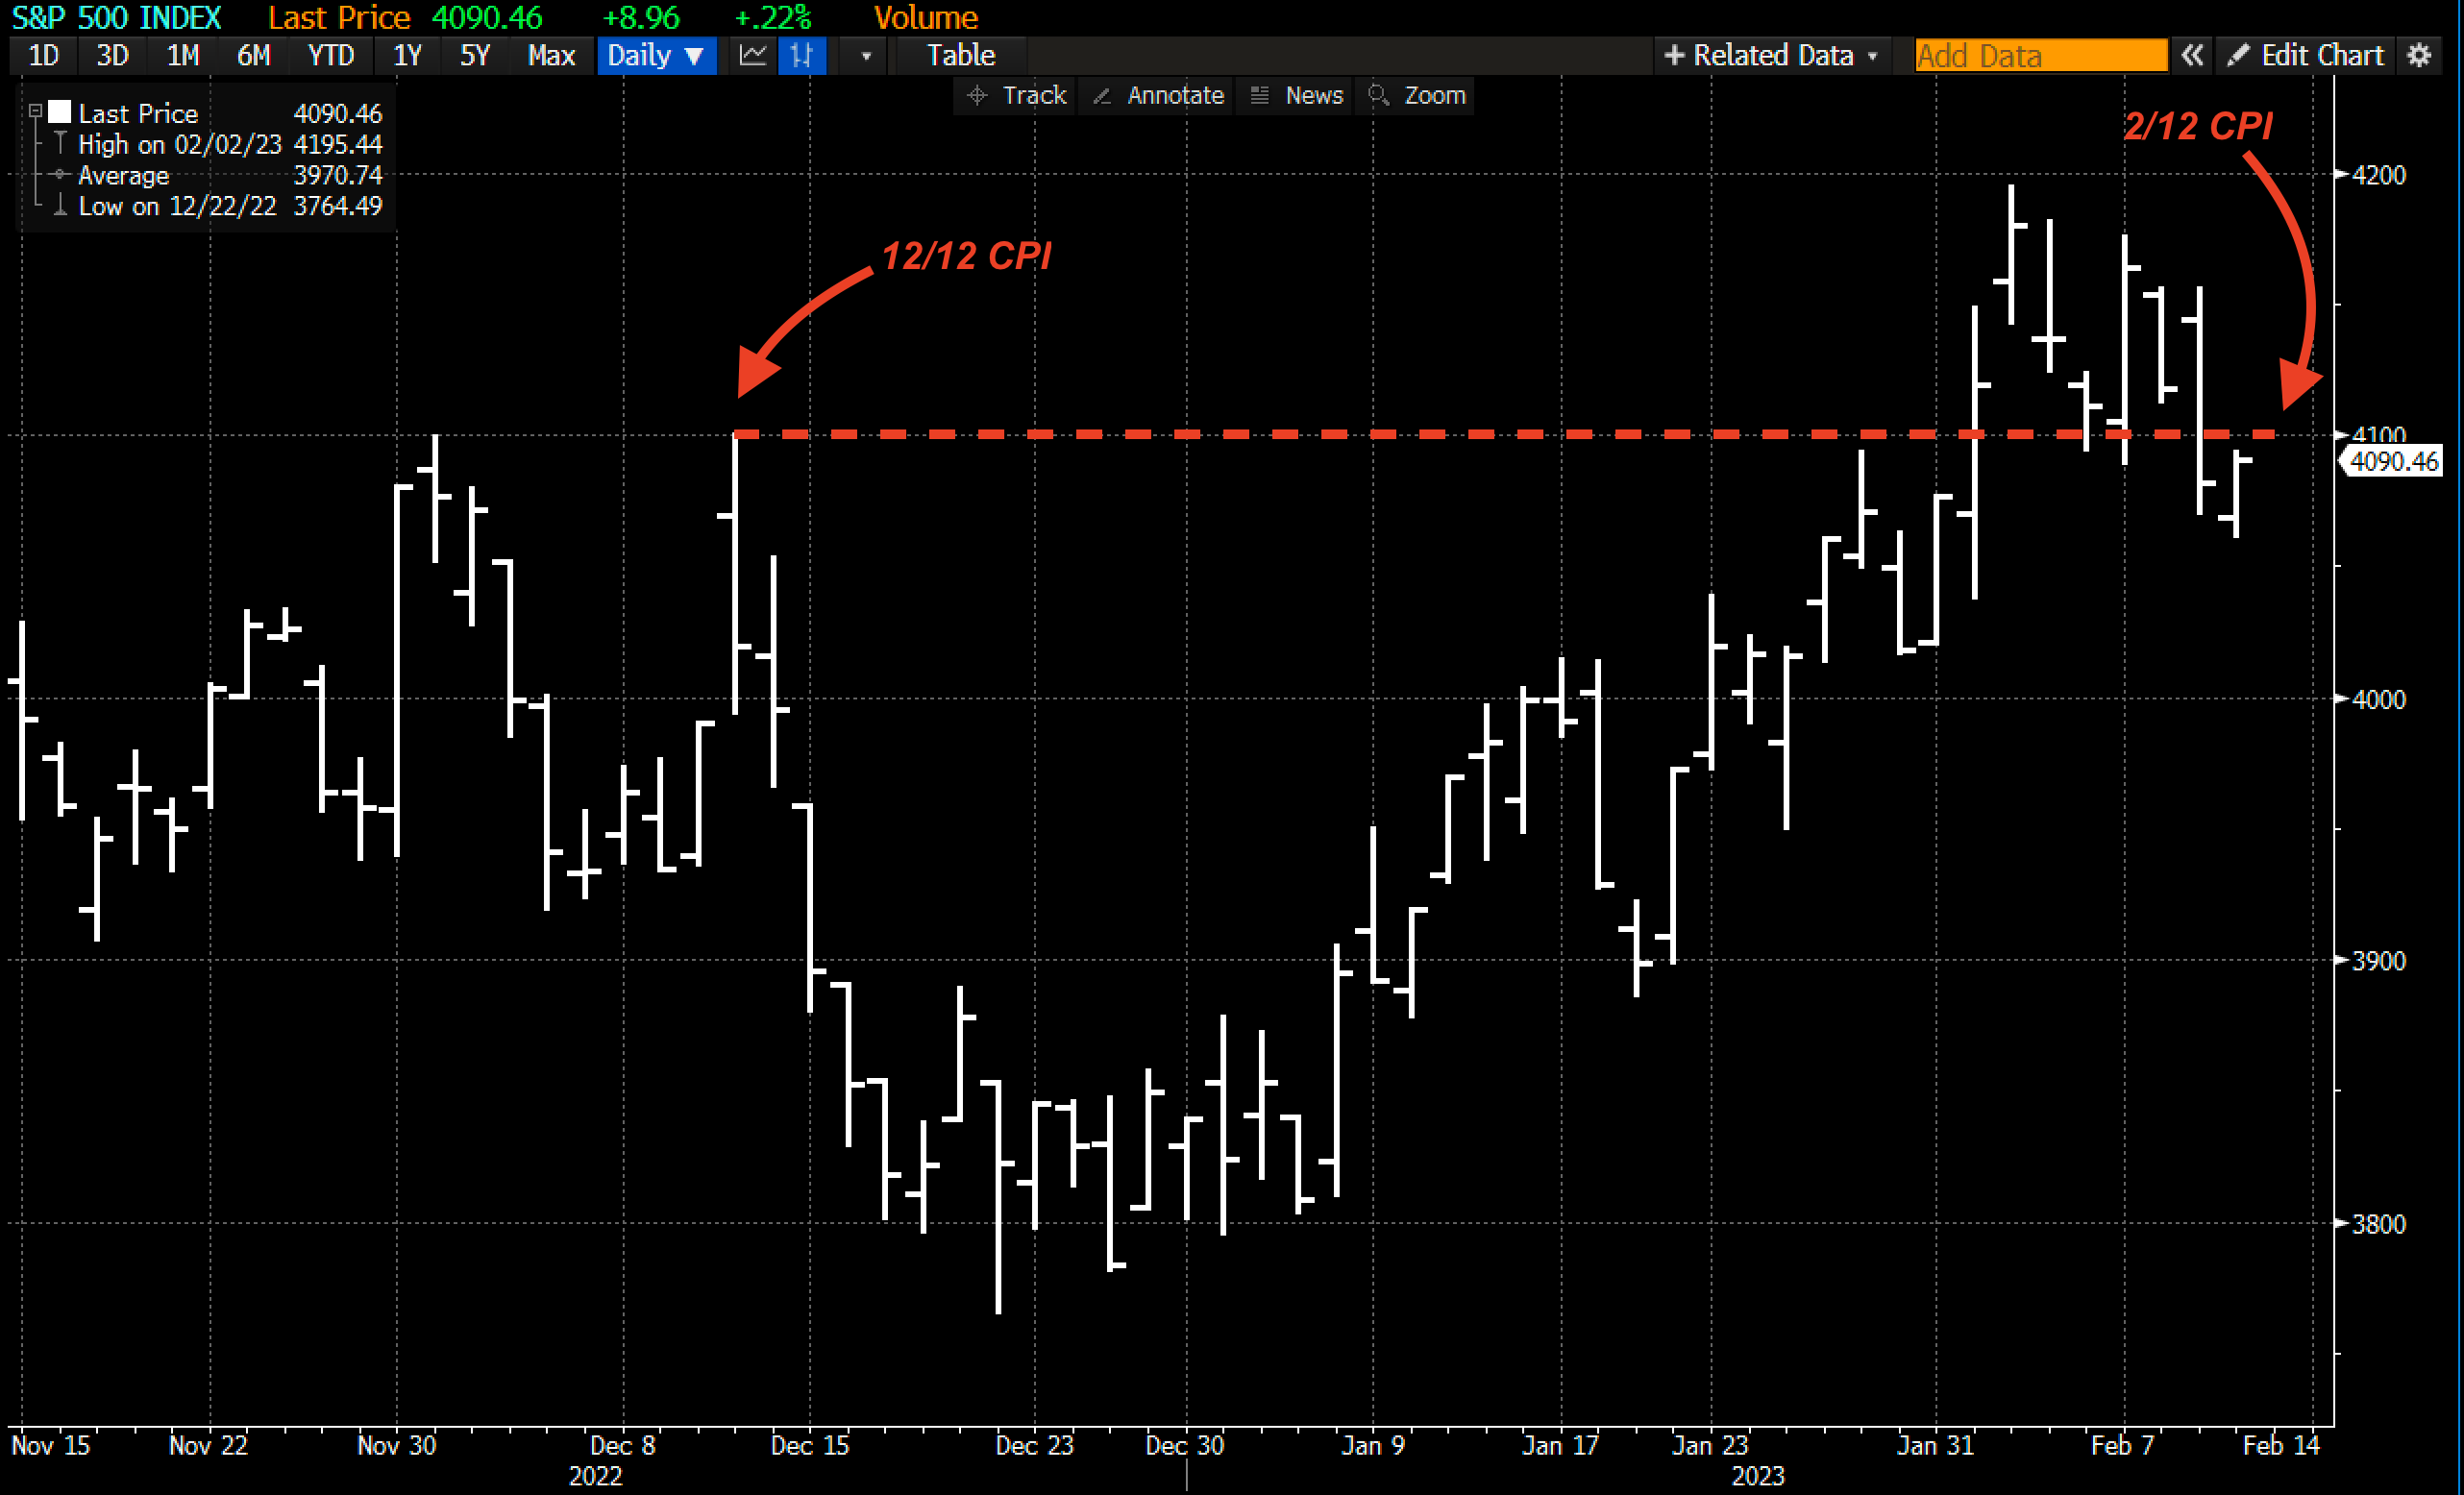
This could well be because investors have begun to add positions/”regross” in January, and therefore have less concern about missing further upside. If this is true, then one could argue that demand for downside hedging may need to increase (a key point raised by @danny_kirsch). This keeps that left “deep downside” tail IV elevated.
| SpotGamma Proprietary SPX Levels | Latest Data | SPX Previous | SPY | NDX | QQQ |
|---|---|---|---|---|---|
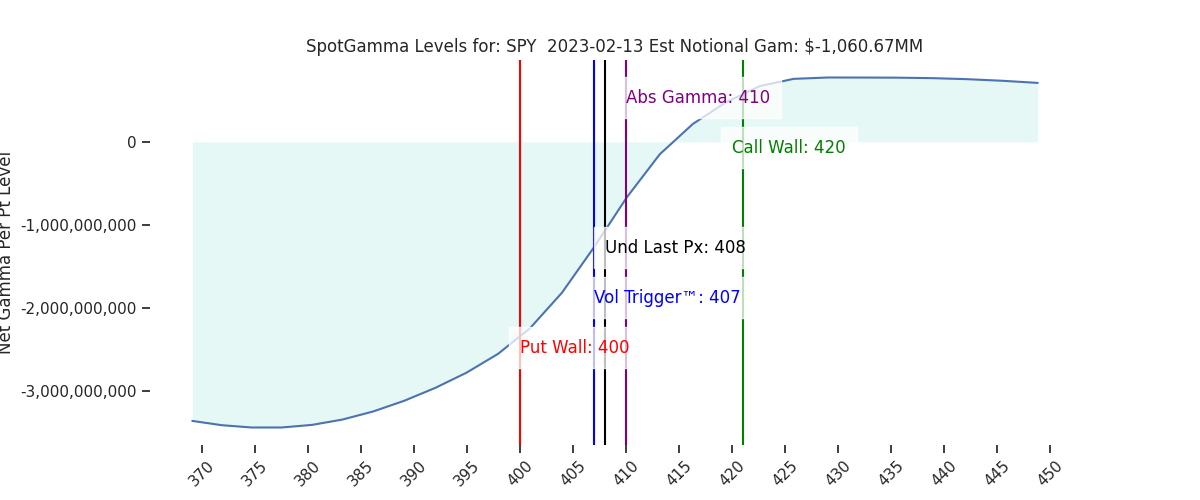
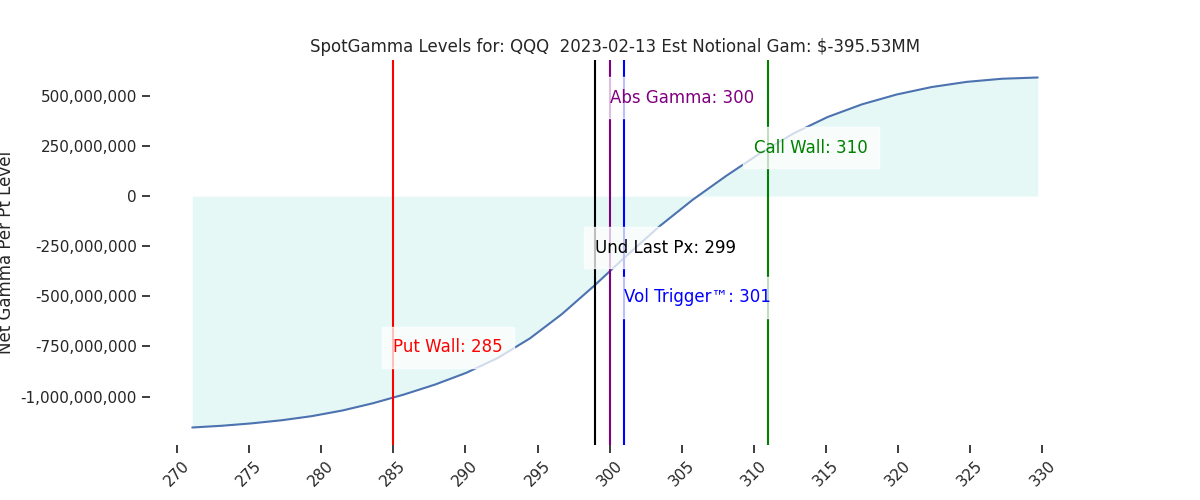
| Ref Price: | 4090 | 4076 | 408 | 12381 | 301 |
| SG Implied 1-Day Move:: | 0.9%, | (±pts): 37.0 | VIX 1 Day Impl. Move:1.29% | ||
| SG Implied 5-Day Move: | 2.76% | 4090 (Monday Ref Price) | Range: 3978.0 | 4203.0 | ||
| SpotGamma Gamma Index™: | 0.36 | 0.09 | -0.22 | 0.01 | -0.05 |
| Volatility Trigger™: | 4060 | 4095 | 407 | 11925 | 304 |
| SpotGamma Absolute Gamma Strike: | 4000 | 4000 | 410 | 13000 | 300 |
| Gamma Notional(MM): | 50.0 | -197.0 | -1061.0 | 2.0 | -272.0 |
| Put Wall: | 3900 | 3900 | 400 | 10500 | 300 |
| Call Wall : | 4200 | 4200 | 420 | 12500 | 310 |
| Additional Key Levels | Latest Data | Previous | SPY | NDX | QQQ |
|---|---|---|---|---|---|
| Zero Gamma Level: | 4076 | 4093 | 413.0 | 11726.0 | 315 |
| CP Gam Tilt: | 1.09 | 0.91 | 0.74 | 1.28 | 0.85 |
| Delta Neutral Px: | 4026 | ||||
| Net Delta(MM): | $1,690,670 | $1,600,861 | $191,864 | $43,944 | $106,686 |
| 25D Risk Reversal | -0.06 | -0.06 | -0.06 | -0.04 | -0.04 |
| Call Volume | 500,546 | 486,904 | 1,874,622 | 5,764 | 798,578 |
| Put Volume | 893,727 | 852,962 | 2,765,152 | 6,839 | 1,134,364 |
| Call Open Interest | 6,048,069 | 6,062,497 | 6,447,105 | 49,877 | 4,986,216 |
| Put Open Interest | 11,108,740 | 10,902,221 | 14,389,863 | 53,276 | 8,416,388 |
| Key Support & Resistance Strikes: |
|---|
| SPX: [4150, 4100, 4050, 4000] |
| SPY: [415, 410, 405, 400] |
| QQQ: [305, 300, 290, 285] |
| NDX:[13000, 12500, 12000, 11500] |
| SPX Combo (strike, %ile): [(4275.0, 83.61), (4250.0, 93.44), (4225.0, 87.72), (4209.0, 77.94), (4201.0, 96.03), (4189.0, 76.3), (4176.0, 91.17), (4160.0, 77.42), (4152.0, 95.72), (4140.0, 76.29), (4123.0, 80.0), (4099.0, 94.97), (4066.0, 86.15), (4062.0, 78.19), (4050.0, 75.97), (4009.0, 84.25), (4000.0, 91.99), (3960.0, 85.0), (3951.0, 93.69), (3911.0, 84.97), (3898.0, 94.09)] |
| SPY Combo: [419.06, 414.16, 408.86, 388.86, 394.17] |
| NDX Combo: [12307.0, 12728.0, 11898.0, 12926.0] |