
Futures are up slightly to 3985. S&P500 volatility estimates remain in line with the last several days: SG Implied move 1.23%, VIX implied move 1.8%. Resistance is in the 4000-4015(SPY400 equivalent) area, with support at 3960 (SPY 395) followed by 3900.
We mention again that the market has had poor liquidity, and this weekends Memorial Day holiday only adds to this. This likely adds to volatility, and aberrant price moves.
Yesterdays changes to open interest reveals call positions were added >=4000, with 4100 & 4200 adding 10k + 15k respectively. Thats not huge, but it was enough to kink the gamma curve in an interesting way.
You can see this below wherein todays curve flattens out >4200, which implies the market may lose steam on a rally into 4200. Recall that yesterday we highlighted 4300 as the point at which the market may stall out, but this updated curve suggests there may be less velocity on a rally >4200. Said another way, the area from 4000-4200 started to fill-in in with call positions which may reduce upside volatility. To this point we note the Vol Trigger shifted down to the 4000 level from 4350 a few days ago. This again is a reflection of positions filling in around the 4000 strike.

Anecdotally, too, it seemed as if there were some trying to take a bullish angle from yesterdays Fed Minutes. It appears the vol curve is unimpressed as shown below. Throw in a -9% move in NVDA after earnings, and it seems the general economic/interest rate picture is no more clear today than yesterday.
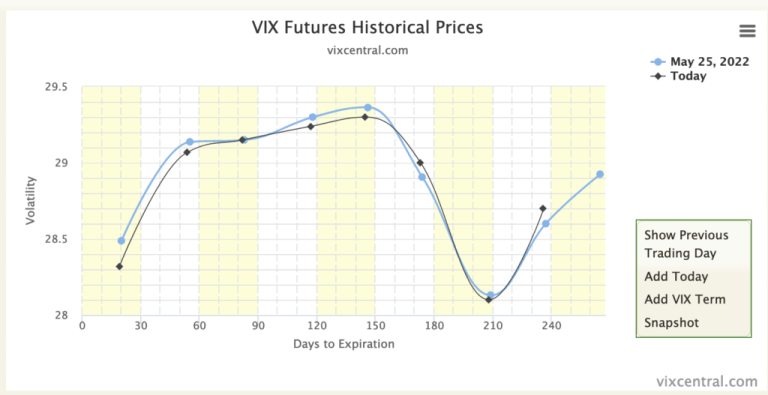
To this point, flushing out a directional edge here is quite a challenge. We do wonder if the Fed Minutes have provided cover for some to start shorting pre-FOMC (6/15) volatility, which is likely why the front month VIX future is under the rest of the VIX curve. Traders may bet that “not much” will happen over the next 2 weeks, and so we will need to keep a close eye on short term IV’s. This may provide the opportunity for some interesting calendar or ratio spreads.
Our overall view remains the same that there likely isn’t a material “risk on” until June 15th, due to the fact that it’s unlikely traders will begin to sell large puts & longer dated volatility before FOMC (i.e. fully deflate the VIX term structure above).
We therefore continue to assign an edge to the S&P remaining <4000, but one must respect a chance for upside volatility before 6/15, as dealers would likely need to buy deltas if markets start to rally and large June puts decay.
| SpotGamma Proprietary Levels | Latest Data | Previous | SPY | NDX | QQQ |
|---|---|---|---|---|---|
| Ref Price: | 3978 | 3974 | 397 | 11941 | 291 |
| SpotGamma Imp. 1 Day Move: Est 1 StdDev Open to Close Range |
1.23%, | (±pts): 49.0 | VIX 1 Day Impl. Move:1.81% | ||
| SpotGamma Imp. 5 Day Move: | 2.92% | 3901 (Monday Ref Px) | Range: 3787.0 | 4015.0 | ||
| SpotGamma Gamma Index™: | -1.25 | -1.48 | -0.18 | 0.00 | -0.08 |
| Volatility Trigger™: | 4000 | 4100 | 400 | 11775 | 300 |
| SpotGamma Absolute Gamma Strike: | 4000 | 4000 | 400 | 11800 | 300 |
| Gamma Notional(MM): | -683.0 | -636.34 | -971.0 | 1.0 | -572.0 |
| Additional Key Levels | Latest Data | Previous | SPY | NDX | QQQ |
|---|---|---|---|---|---|
| Zero Gamma Level: | 4175 | 4171 | 0 | 0 | 0 |
| Put Wall Support: | 3700 | 3700 | 380 | 12000 | 280 |
| Call Wall Strike: | 4500 | 5000 | 402 | 11800 | 310 |
| CP Gam Tilt: | 0.67 | 0.66 | 0.63 | 1.1 | 0.6 |
| Delta Neutral Px: | 4222 | ||||
| Net Delta(MM): | $1,776,612 | $1,558,981 | $175,135 | $54,836 | $114,578 |
| 25D Risk Reversal | -0.07 | -0.06 | -0.06 | -0.08 | -0.09 |
| Call Volume | 407,361 | 365,067 | 1,601,683 | 9,712 | 811,334 |
| Put Volume | 711,614 | 606,340 | 1,824,752 | 5,817 | 754,915 |
| Call Open Interest | 5,871,950 | 5,856,946 | 6,808,518 | 61,415 | 4,687,197 |
| Put Open Interest | 10,398,301 | 9,588,722 | 10,465,067 | 58,193 | 6,745,480 |
| Key Support & Resistance Strikes: |
|---|
| SPX: [4200, 4100, 4000, 3900] |
| SPY: [400, 395, 390, 380] |
| QQQ: [310, 300, 290, 280] |
| NDX:[12500, 12025, 12000, 11800] |
| SPX Combo (strike, %ile): [3899.0, 3998.0, 3951.0, 3875.0, 3923.0] |
| SPY Combo: [389.39, 399.33, 394.56, 387.01, 391.78] |
| NDX Combo: [11799.0, 11691.0, 11894.0] |


