
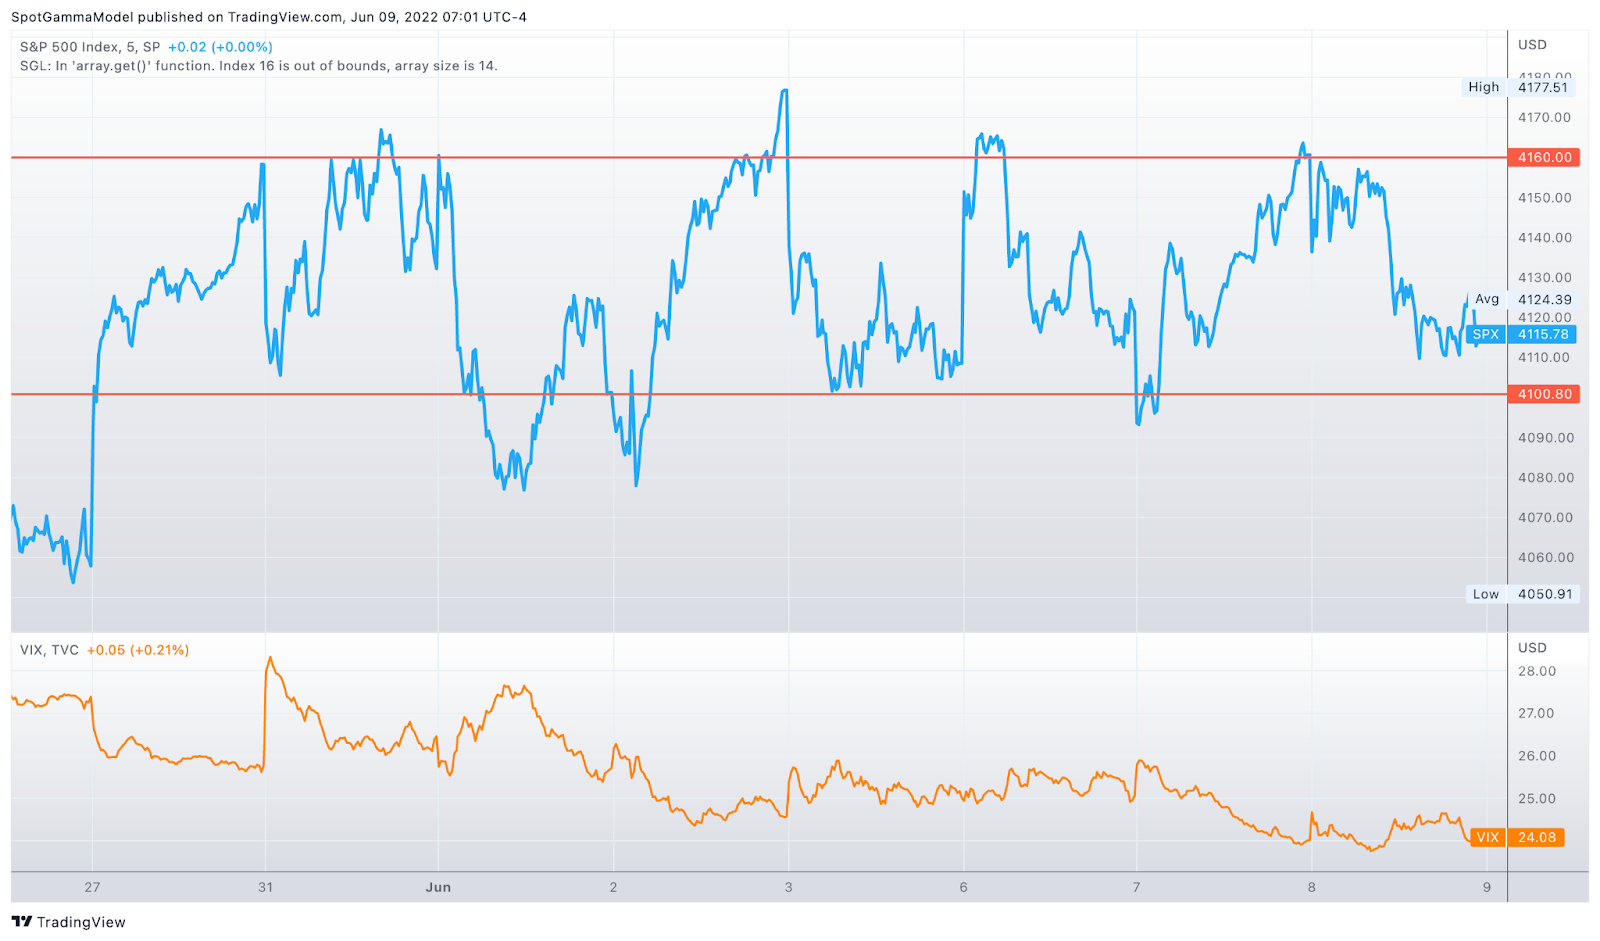
Futures are trading to 4135, up from overnight lows of 4104. Volatility estimates remain in line with that of the last several days: SG Implied Move 1.0%. Support holds at 4100, with resistance standing at the 4150-4160 area.
This morning traders will be closely watching the 8:30AM ET ECB conference.
Yesterday morning we posted the chart below of the 4100-4160 SPX channel, and since then we’ve rejected the 4160 area yesterday and held a 4100 futures test overnight. Note the VIX is checking down to that lower bound level of 24 (3 week lows) despite the fact that the SPX isn’t making new highs.
This is all in line with our forecasts tied to large 6/15 VIX exp & 6/17 OPEX positions.
Today may be the last bit of relative calm as we look for these ranges hold again. However, prices may dislodge from this 4100-4160 range with tomorrows 8:30 AM ET CPI print, as traders being to adjust FOMC forecasts. Further we expect volatility to increase into Tuesday due to the large VIX expiration positions and expiration on Wednesday AM (reminder that the last day that 6/15 VIX index options trade is on Tuesday).
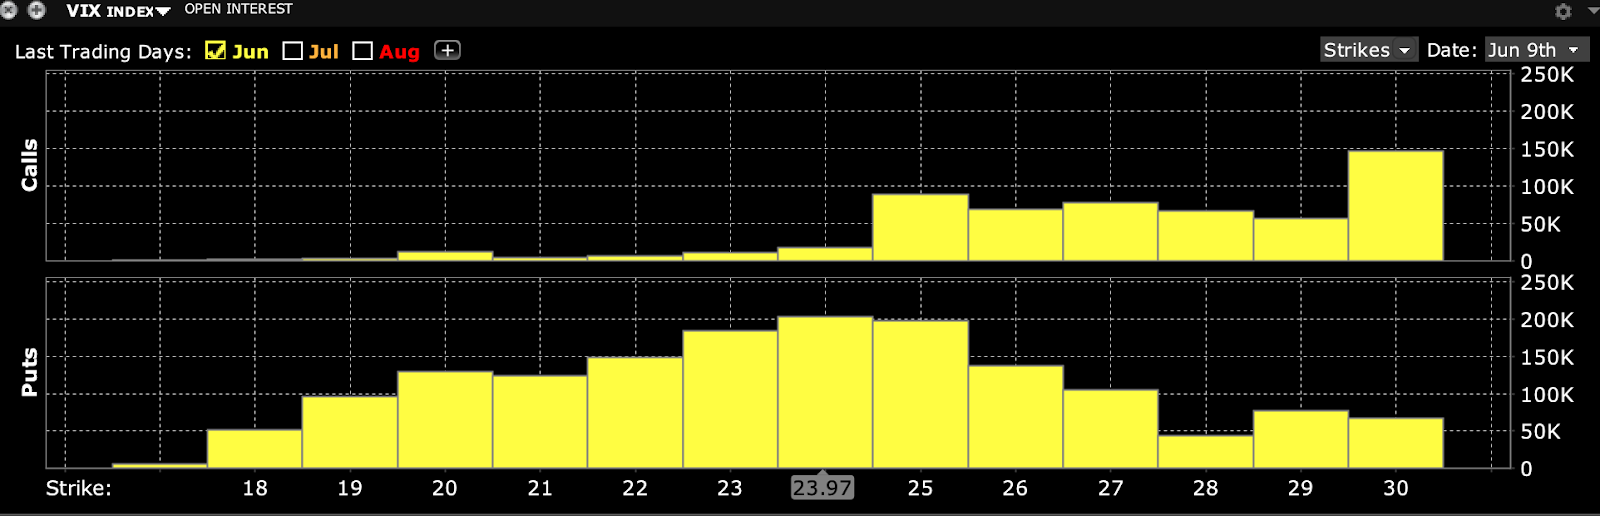
Below is an update of those big VIX put positions, with 24 still the large put interest line. Note sizable interest at the 30 call, too.
To this point, we highlight that tail demand (both tails) remains quiet. We base this from our Risk Reversal indicator shown below, and the VVIX. This -0.07 reading is telling us that the S&P skew is pretty neutral and we expect a shift in this out of next week.
Our view is that the VIXexp/FOMC/OPEX is going to trigger some “risk on” will calls catching some demand and a RR reading near -0.05, or traders will look to roll heavily into puts which sends the RR down to -0.10. Again we highlight 4300 & 4000 as the two key levels we’re watching into month end.

As we think this is possibly the last day of relative calm we recommend considering your post-OPEX hedging or positioning today. For example, a benign CPI print tomorrow could spark a pulling-forward of VIXexp/OPEX short-hedge covering which drains the vanna/charm flows (again note that >4200 is where we think OPEX fuel is nullified).
Conversely we could get a pretty quick and violent drawdown to 4000 with a heavy CPI print as there remains large put strikes <=4100.
Even if CPI is a non-event we are looking for some large moves on Tuesday due to that VIX expiration, as a VIX complex wrestles with a steep contango and FOMC event on Wednesday. Well discuss this in more depth on Monday as we will be closer to VIX exp.

| SpotGamma Proprietary Levels | Latest Data | Previous | SPY | NDX | QQQ |
|---|---|---|---|---|---|
| Ref Price: | 4115 | 4114 | 411 | 12612 | 307 |
| SpotGamma Imp. 1 Day Move: Est 1 StdDev Open to Close Range |
0.98%, | (±pts): 40.0 | VIX 1 Day Impl. Move:1.51% | ||
| SpotGamma Imp. 5 Day Move: | 2.48% | 4108 (Monday Ref Px) | Range: 4006.0 | 4210.0 | ||
| SpotGamma Gamma Index™: | -0.72 | -0.14 | -0.16 | 0.01 | -0.07 |
| Volatility Trigger™: | 4110 | 4110 | 411 | 11775 | 308 |
| SpotGamma Absolute Gamma Strike: | 4000 | 4000 | 400 | 12500 | 300 |
| Gamma Notional(MM): | -426.0 | -507.03 | -814.0 | 1.0 | -426.0 |
| Additional Key Levels | Latest Data | Previous | SPY | NDX | QQQ |
|---|---|---|---|---|---|
| Zero Gamma Level: | 4191 | 4190 | 0 | 0 | 0 |
| Put Wall Support: | 4000 | 4000 | 400 | 12000 | 300 |
| Call Wall Strike: | 4200 | 4200 | 420 | 11800 | 310 |
| CP Gam Tilt: | 0.84 | 0.77 | 0.73 | 1.09 | 0.74 |
| Delta Neutral Px: | 4238 | ||||
| Net Delta(MM): | $1,820,830 | $1,774,282 | $177,325 | $68,974 | $115,591 |
| 25D Risk Reversal | -0.07 | -0.07 | -0.06 | -0.07 | -0.07 |
| Call Volume | 380,229 | 376,370 | 1,470,771 | 9,020 | 530,317 |
| Put Volume | 652,961 | 747,116 | 1,760,582 | 10,166 | 694,578 |
| Call Open Interest | 6,179,092 | 6,081,900 | 6,977,195 | 72,539 | 4,731,720 |
| Put Open Interest | 11,053,252 | 10,968,735 | 11,468,682 | 70,987 | 7,283,761 |
| Key Support & Resistance Strikes: |
|---|
| SPX: [4200, 4150, 4100, 4000] |
| SPY: [420, 415, 410, 400] |
| QQQ: [320, 310, 305, 300] |
| NDX:[13000, 12500, 12000, 11800] |
| SPX Combo (strike, %ile): [4001.0, 4050.0, 4198.0, 4075.0, 4005.0] |
| SPY Combo: [399.76, 404.7, 419.51, 407.17, 400.18] |
| NDX Combo: [12297.0, 12714.0] |


