
Futures are off slightly to 4135. Resistance lies at 4145(Vol Trigger), 4160 (SPY 415) then 4200. Support shows at 4100.
There were two key data shifts today:
- 1) Vol Trigger shifting to 4145.
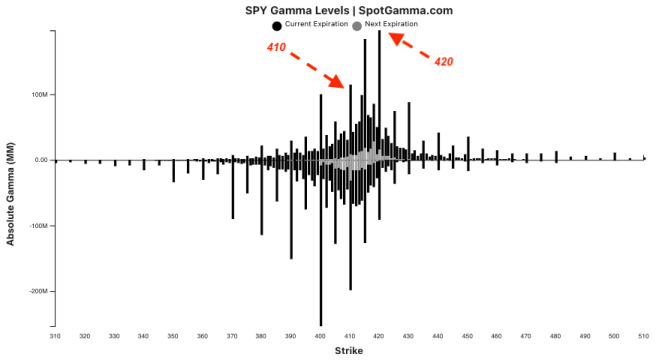
- 2) SPY Call Wall shifting to 420 from 415
In regards to the SPY Call Wall shift, its interesting as we saw heavy call selling on yesterdays opening rally. We believe this was traders electing to short 420 calls. These new positions build the resistance area up near 420SPY/4200SPX and shifts some pull away from 415/4150. This shift in the Call Wall is generally considered a bullish indication.
Next, we highlight the Vol Trigger shifting higher to 4145. If the S&P trades <Vol Trigger we officially hold a bearish stance, however the larger risk-off level to watch here is 410SPY/4100SPX. This is due to the large open interest at 410, as as shown below. We would note here that we could see some “jumpiness” of the Vol Trigger level around 4100, due to transient open interest (well touch on below).
The rising Vol Trigger suggests that this market is rather unstable, as not only is the SPX on its gamma flip point, but both SPY & QQQ are in a negative gamma position (i.e. <Vol Trigger). This position is a function of ATM call positions failing to build, as discussed yesterday.
As markets lose positive gamma, we believe volatility expands, which skews the market return distributions. For example, in this case the market has heavy upside resistance in the 4150-4200 area (50-80 handles from current ES levels) but a break of 4100, we believe, leads to a retest of 4000 (130 handles).
Said differently, with SPX>4100 we would expect mean reverting market behavior (buy dips, sell rips). SPX<4100 we look for a one way move down to 4000.
You may note some confliction here as we see the higher SPY Call Wall as bullish, but a large gap higher in the Vol Trigger which is seen as bearish.
So much of what trades now is in very short dated positions, which results in less stability. Generally during large stable market rallies we see call positions go ITM, which provides a base of positive gamma around which the Call Walls shift. This would lead into a tightening of trading ranges into monthly options expirations. At monthly expiration, large positive gamma call positions would expire, which would un-clench markets.
In this current environment we are not getting those long term calls which stabilize markets. We seem to get shifty, short dated positions. In our view this leads to jumpy price action and large trading ranges.
Finally, we wanted to comment on the resurgence of meme mania. Stocks like AMC & BBBY traded markedly higher today, with massive options volumes. Plotted below is the HIRO data for AMC, and you can see that the signal peaked right around 9:45 after a huge burst in call buying. Immediately following that, an even large wave of call sales came in.

Into this AM rush we saw implied volatility blow out (plotted below), and this is our key point. We think that market makers now push options prices higher much more quickly that in the past, and this serves to snuff out these violent intraday rallies. Higher options prices serves to entice call sellers (both opening and closing) but also deter buying.

| SpotGamma Proprietary SPX Levels | Latest Data | SPX Previous | SPY | NDX | QQQ |
|---|---|---|---|---|---|
| Ref Price: | 4140 | 4140 | 412 | 13159 | 320 |
| SpotGamma Imp. 1 Day Move: Est 1 StdDev Open to Close Range |
1.17%, | (±pts): 48.0 | VIX 1 Day Impl. Move:1.35% | ||
| SpotGamma Imp. 5 Day Move: | 3.05% | 4144 (Monday Ref Px) | Range: 4018.0 | 4271.0 | ||
| SpotGamma Gamma Index™: | 0.40 | 0.64 | -0.11 | 0.02 | -0.04 |
| Volatility Trigger™: | 4145 | 4090 | 413 | 12720 | 321 |
| SpotGamma Absolute Gamma Strike: | 4000 | 4000 | 400 | 12500 | 310 |
| Gamma Notional(MM): | 64.0 | 90.64 | -622.0 | 4.0 | -264.0 |
| Additional Key Levels | Latest Data | Previous | SPY | NDX | QQQ |
|---|---|---|---|---|---|
| Zero Gamma Level: | 4117 | 4117 | 0 | 0 | 0 |
| Put Wall Support: | 4000 | 3900 | 400 | 12500 | 290 |
| Call Wall Strike: | 4200 | 4200 | 420 | 11925 | 330 |
| CP Gam Tilt: | 1.12 | 1.06 | 0.8 | 1.36 | 0.82 |
| Delta Neutral Px: | 4074 | ||||
| Net Delta(MM): | $1,674,696 | $1,632,164 | $192,213 | $63,569 | $104,799 |
| 25D Risk Reversal | -0.06 | -0.07 | -0.05 | -0.06 | -0.06 |
| Call Volume | 375,171 | 338,339 | 1,295,141 | 7,437 | 560,533 |
| Put Volume | 833,279 | 790,070 | 2,255,937 | 9,096 | 888,048 |
| Call Open Interest | 5,889,607 | 5,724,882 | 7,123,393 | 64,347 | 4,088,659 |
| Put Open Interest | 10,459,070 | 10,281,496 | 12,717,025 | 62,903 | 7,038,384 |
| Key Support & Resistance Strikes: |
|---|
| SPX: [4200, 4150, 4100, 4000] |
| SPY: [420, 415, 410, 400] |
| QQQ: [325, 320, 310, 300] |
| NDX:[14000, 13500, 13000, 12500] |
| SPX Combo (strike, %ile): [4198.0, 4148.0, 4252.0, 4227.0, 4173.0] |
| SPY Combo: [418.77, 413.82, 424.14, 421.66, 416.29] |
| NDX Combo: [13541.0, 13330.0] |


